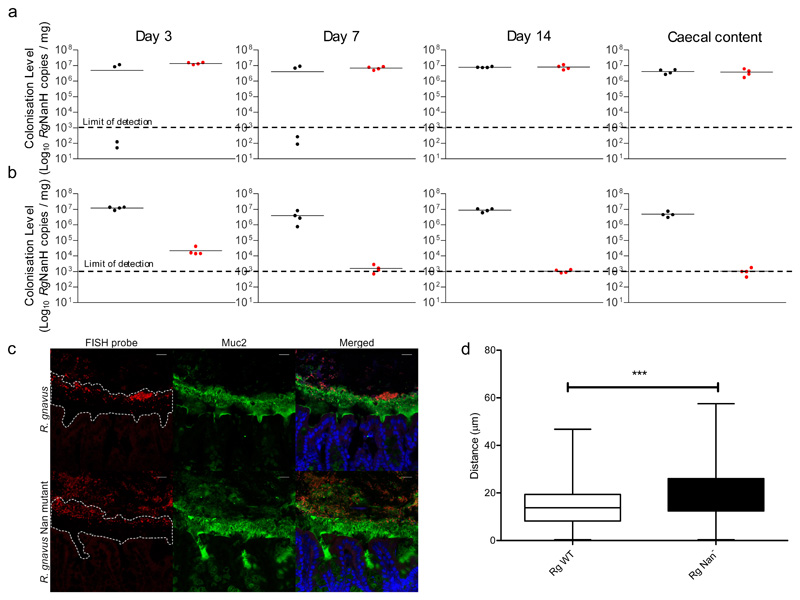
Figure 6. Colonisation of germ-free C57BL/6J mice with R. gnavus ATCC 29149 wild-type or nan mutant strains.
Mice were monocolonised with a and b sample size (n) and define centre measure mean (a) R. gnavus wild-type (black; n = 4) or nan mutant (red; n = 4) strains individually or (b) in competition (n = 4). Mice were orally gavaged with 1x10⁸ of each strain, faecal samples were analysed at 3,7 and 14 days after inoculation and caecal samples at 14 days after inoculation using qPCR, centre line denotes the mean. (c) Fluorescent in situ hybridisation (FISH) and immunostaining of the colon from R. gnavus monocolonised C57BL/6 mice. R. gnavus ATCC 29149 and R. gnavus nan mutant are shown in red. The mucus layer is shown in green and an outline of the mucus is shown in the first panels. Cell nuclei were counterstained with Sytox blue, shown in blue. Scale bar: 20 μm. Image is representative of 70 total images (d) Quantification of the distance between the leading front of bacteria and the base of the mucus layer. A total of 70 images of stained colon from 8 R. gnavus monocolonised mice were analysed. The asterisks (***) show the significance (P=0.0135, by linear mixed model analysis, including fixed effects of genotype and area and random effects of mouse and each individual image. There was substantial spatial correlation between adjacent observations and so an AR(1) correlation structure was added. The resulting model had no residual autocorrelation as judged by visual inspection of autocorrelation function. The nmle package version 3.1-137 using R version 3.5.3 was used to estimate the model), centre point indicates the mean, box limits, upper and lower quartiles; whiskers, minimum and maximum.

