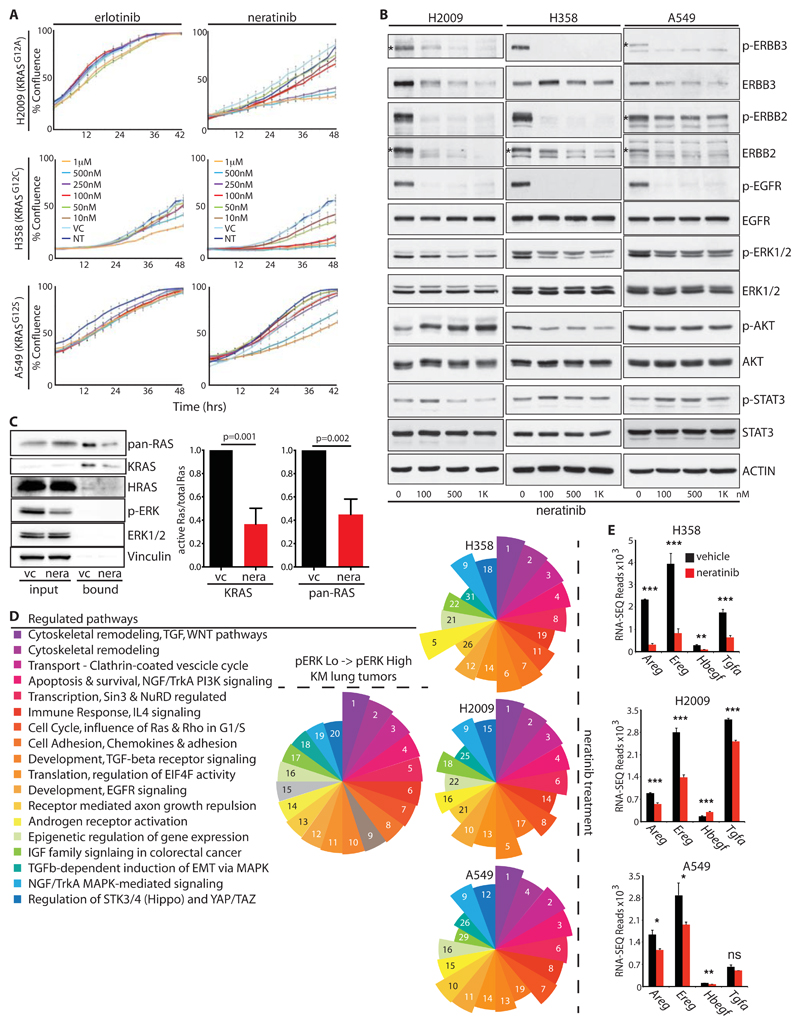
Figure 4. A feed-forward ERBB signaling loop drives proliferation of KRAS-mutant human NSCLC cells.
A) Growth curves of 3 KRAS-mutant human NSCLC lines upon treatment with increasing doses of the EGFR-selective inhibitor erlotinib or the multi-ERBB inhibitor, neratinib, measured by Incucyte time-lapse video-microscopy. Error bars show SD for technical triplicates. Data are representative of at least 2 independent experiments. B) Lysates from KRAS-mutant NSCLC cells treated with increasing doses of neratinib, immunoblotted with the indicated antibodies. Asterisks, where present, indicate the correct band. C) RAS immunoblots of RAF-coated bead precipitates from lysates of A549 cells treated with neratinib or vehicle control for 2 hours. Lysate input aliquots were also immunoblotted with the indicated antibodies. Right panel shows mean ± SEM for quantification of KRAS band intensities from 3 independent experiments (arbitrary units). P values are from 2-tailed T-tests. D) Top 20 significantly modulated pathways associated with the transition to p-ERKHigh disease in the KM model, identified using Metacore GeneGO analysis of RNA-SEQ expression data. Segment size in the pie chart (left panel) reflects ranking of the pathways by false discovery rate (FDR). Right panels show that 18 of the same pathways are modulated in each of 3 KRAS-mutant human NSCLC lines after overnight treatment with neratinib (250nM for A549 and H2009; 25nM for H358). Numbers and pie segment size reflect ranking by FDR. E) Expression of ERBB ligands in the indicated cells treated overnight with vehicle (black) or neratinib (red), measured by RNA-SEQ as per (D). Mean & SEM of biological triplicates shown. P values are from 2-tailed T-tests, abbreviated as follows: * =<0.05; ** = <0.01; *** <0.0001; ns = not significant.

