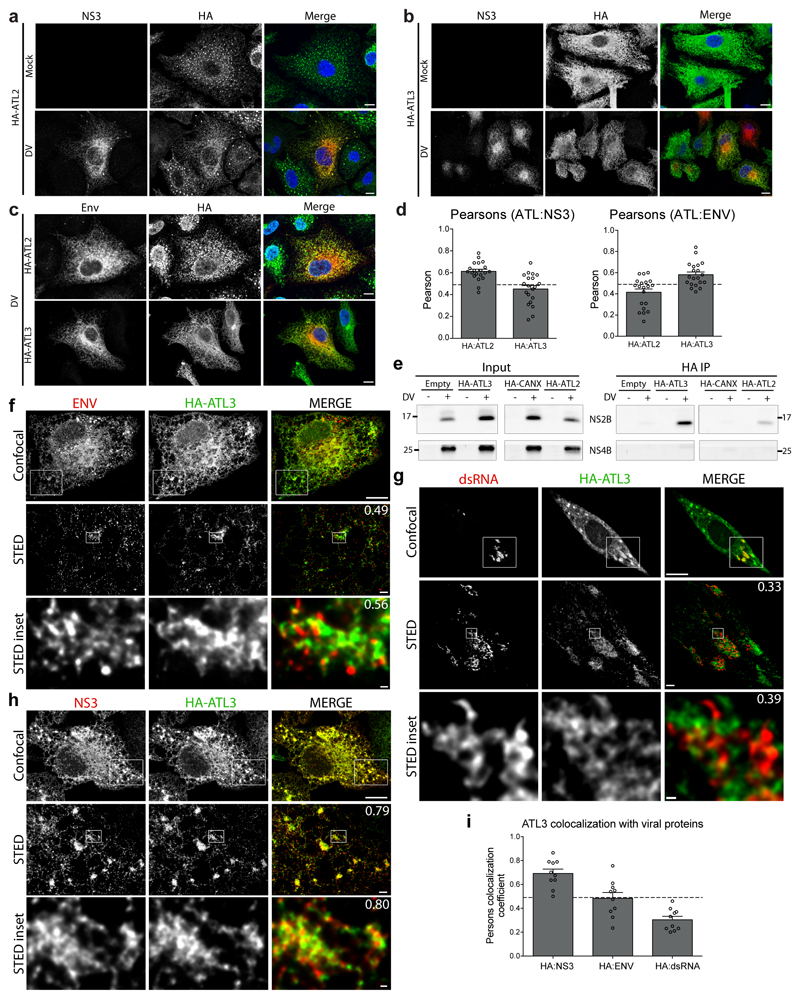
Extended Data Figure 4. ATLs associate with distinct DV proteins.
a-c, A549 cells stably expressing HA-ATL2 or HA-ATL3 were infected with DV for 48 h. Cells were then fixed and stained with antibodies directed against NS3 or Env and the HA epitope, respectively. Scale bars, 10 μm. d, Pearson’s colocalization coefficients were calculated for cells from panels a-c. The graph shows the average value from 20 cells for each condition. Error bars, SEM. e, A549 cells stably expressing HA-ATL2, HA-ATL3, HA-CANX, or an empty plasmid were infected with DV for 48 h. Cells were lysed and HA-tagged proteins were immunoprecipitated with anti-HA beads. Inputs and precipitated proteins were analyzed by western blot using NS2B- and NS4B-specific antibodies. Breaks between adjacent blots indicate lanes not relevant to the experiment were removed. f-h, A549 cells stably expressing HA-ATL3 were infected with DV for 48 h. Cells were fixed and stained with antibodies directed against virus proteins or dsRNA (RED) and the HA epitope (green). Pearson’s colocalization coefficients for merge images are given in the top right corners. Images were taken using an Abberior instruments STED microscope. Scale bars, confocal 10 μm, STED 1 μm, inset 100 nm. i, Average Pearson’s colocalization coefficients were calculated for the fluorescent signal corresponding to the HA-tagged ATL3 compared to those from the indicated viral proteins in STED microscopy images. Graph shows the average Pearson’s colocalization coefficients calculated for 10 cells. Error bars, SEM.

