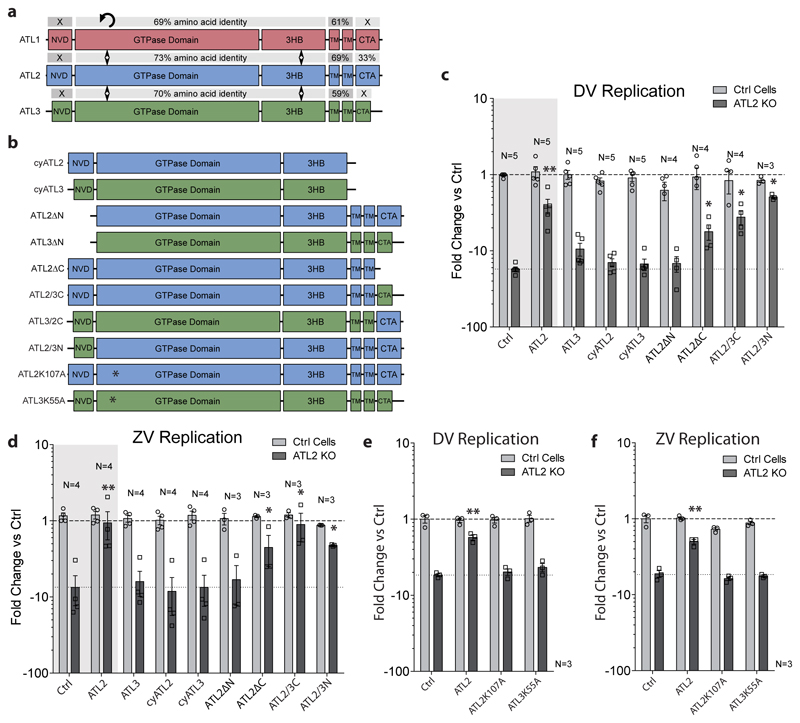
Figure 3. Mapping of functional domains of ATLs involved in the DV replication cycle.
a, Sequence comparison of human ATL1, ATL2, and ATL3 proteins, showing the amino acid sequence identity of each annotated domain. Sequences were aligned using the NCBI BLAST server. NVD, N-terminal variable domain; 3HB, three-bundle Helix; TM, transmembrane region; CTA, C-terminal amphipathic-helix domain. b, Schematic representation of ATL2 and ATL3 mutant constructs used for rescue experiments. Names of expressed proteins are given on the left. c-f, ATL2 knockout or control cells were transduced with lentivirus encoding for the ATL variant given on the bottom of each panel. 24 h after transduction, cells were infected with DV-R2A (c and e) or synZV-R2A (d and f) for 48 h. Graphs show viral replication expressed as average fold change in RLU/mL relative to control cells transfected with the empty plasmid (Ctrl). Numbers above each bar pair in c and d refers to the number of independent experiments. Lower dashed line indicates the difference between ATL2 KO cells and ctrl cells, both transduced with an empty plasmid. For all graphs, error bars represent SEM; * or ** represent p values < 0.05 or 0.01, respectively calculated by one-way ANOVA with a Dunnett’s multiple comparison analysis.

