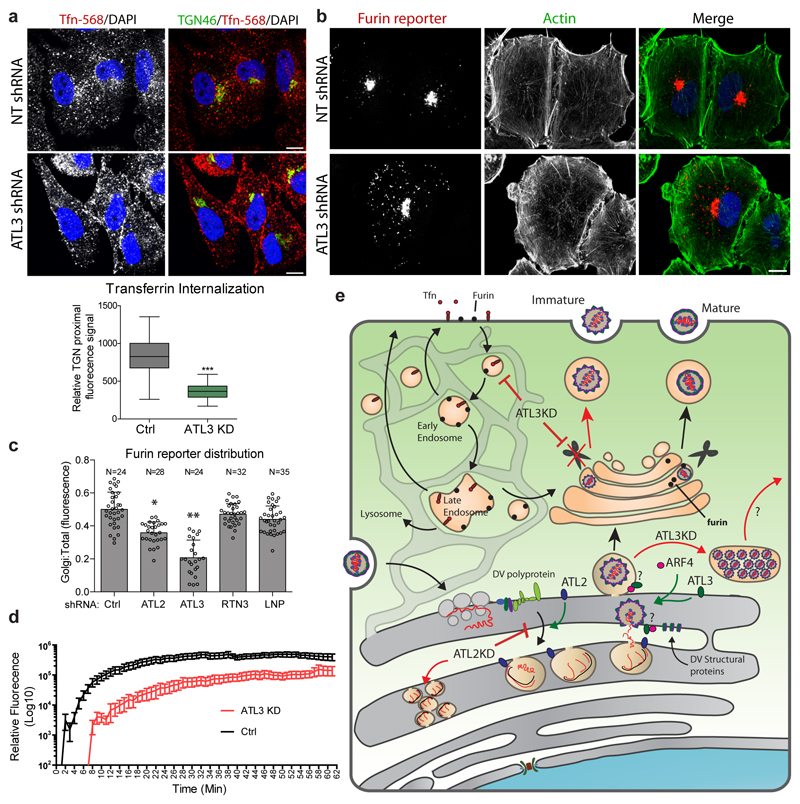
Figure 6. ATL3 depletion alters retrograde transport.
a, A549 cells were transduced with constructs encoding for shRNA directed against ATL2, ATL3 or a non-targeting (NT) shRNA. 96 h after transduction, cells were serum starved for 30 mins followed by incubation with Alexa fluor 568-conjugated transferrin (Tfn-568) for 40 mins. Cells were then fixed and stained for the trans-Golgi marker TGN46 using specific antibodies. Cells were analyzed by confocal microscopy (upper panel). Scale bars, 10 μm. The relative levels of Tfn-568 signal proximal to the TGN46 signal in control or ATL3 depleted cells is shown in the lower panel. Box, 25th-75th percentile; line shows mean value; Whiskers, min to max. N=52 cells were counted per sample over 2 biological replicates. ***, p value < 0.001 based on 2-tailed T-Test,. b-d, A549 cells stably expressing the furin reporter (CD4-Fu) were transduced with constructs encoding for shRNA directed against the indicated gene or a NT shRNA. b, 72 h after transduction, cells were fixed and the subcellular localization of the furin reporter was evaluated using immunofluorescence staining and confocal microscopy. N=3 biological replicates. c, Total cellular fluorescence and Golgi fluorescence were quantified and calculated for ≥20 cells for each condition. The graph shows the mean ratio between Golgi and total cellular fluorescence levels. Error bars show SEM. RTN3, reticulon 3; LNP, lunapark. d, 72 h post transduction, cells were imaged at 1 minute intervals. Following the 2 min time point, anti-CD4 fluor-conjugated antibodies were added and imaging continued for 1 h. Graphs shows mean total cellular fluorescence levels for ≥20 cells at each time point. N=3 biological replicates. e, Model for the function of ATLs in flavivirus infection, highlighting the role of ATL2 in VP formation and ATL3 in virus particle maturation and vesicular transport.

