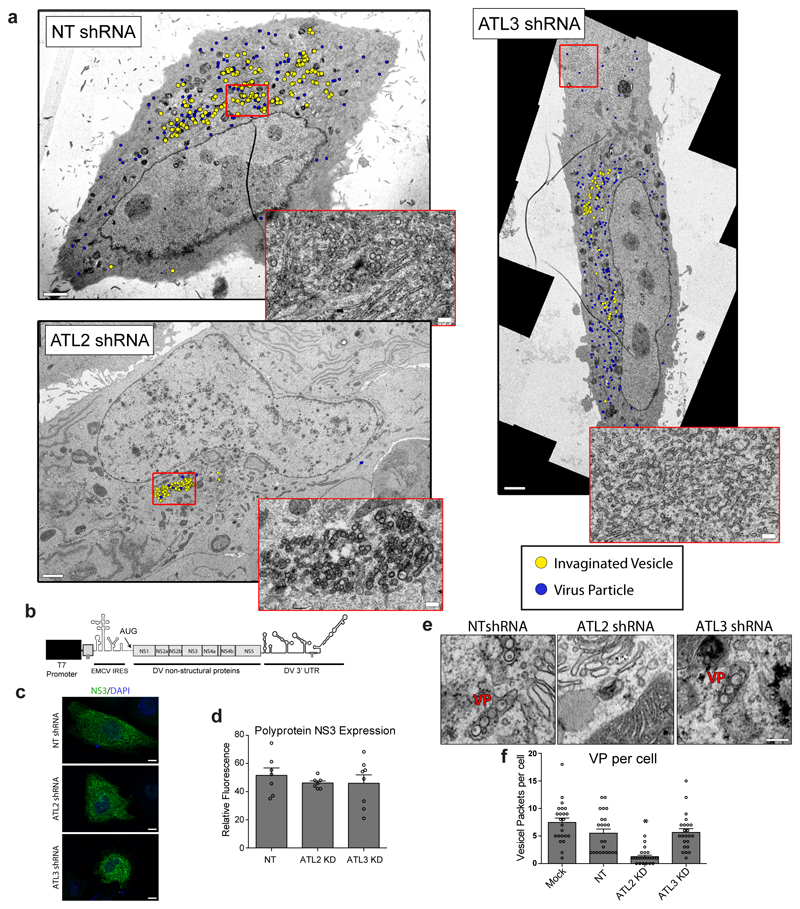
Extended Data Figure 3. Effects of ATL depletion on virus-induced membrane alterations.
Cells were transduced with constructs encoding for shRNAs directed against ATL2 or ATL3, or a NT shRNA. a, 48 h after transduction, cells were infected with DV and 48 h later fixed and processed for viewing by TEM. Invaginated vesicles (yellow dots) and viral particles (blue dots) were determined by counting using Fiji software. Inserts display magnified views of the boxed area (scale bars, 2 μm; inset, 200 nm). Note the accumulation of ER tubular networks at the cell periphery in ATL3 depleted cells. b-f, Huh7-Lunet cells stably expressing the bacterial T7 RNA polymerase were transduced for 48 h, followed by transfection with a construct encoding for the viral polyprotein and containing the 3’ untranslated region (UTR) of the DV genome (panel b). c, 24 h post transfection, cells were fixed and stained with antibodies specific to the viral NS3 protein and visualized by confocal light microscopy. Scale bars, 10 μm. d, Graph shows the average relative fluorescence signal of NS3 in shRNA transduced cells. N=7 independent samples. e, Representative EM images of polyprotein expressing cells from a total of 3 independent experiments. Scale bars, 200nm. f, VPs in each cell were counted and mean values are represented in the graph (N=23 cells, error bars represent SEM). For all graphs * and ** represent p values lower than 0.05 or 0.01, respectively as determined by 2-tailed T-test.

