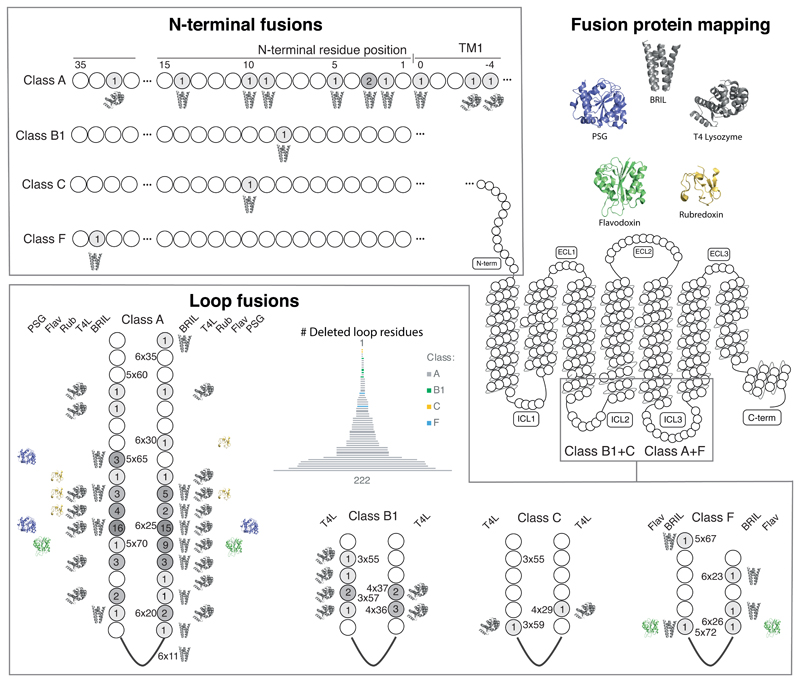
Figure 5.
Mapping of fusion proteins and fusion sites in all GPCR structure constructs. Mapping of fusion proteins shows that BRIL and T4L have been incorporated across a wide range of positions, in contrast to rubredoxin, PSG and flavodoxin. The number of receptors that have utilised a given fusion site (include linkers) are shown within each position in greyscale. Residue positions in the loops are indexed with the GPCRdb generic residue numbering scheme34, whereas N-terminal fusion sites represent their lengths (no. residues) after truncation (Supplementary Note).

