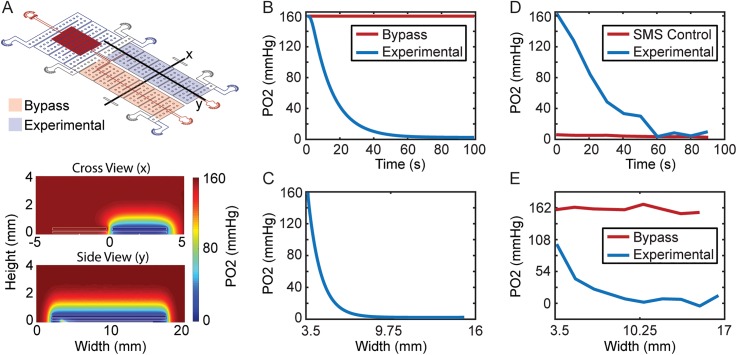
FIG. 1.
COMSOL oxygen transport modeling. (a) Cross-sectional and longitudinal device steady state views showing the device oxygen concentration profile. (b) Modeling probe at the crossview (x) location, showing that oxygen temporal response takes approximately 60 s to reach 0 mm Hg after switching off oxygen supply in the experimental section, while the bypass section remains unaltered at 160 mm Hg. (c) Spatial analysis shows device is at 0 mm Hg from approximately 7 mm to 15 mm length of the gas channel. (d) Experimental verification of oxygen temporal response using the oxygen sensitive dye Ru(bpy)3 shows the device reaches the 0 mm Hg Ru(bpy)3 SMS control after approximately 60 s but differs in the profile expected from the model. (e) Experimental verification of spatial oxygen response shows the device is at approximately 100 mm Hg at the location blood bends to enter the side view (y) section unlike the 160 mm Hg assumption in the model but still reaches 0 mm Hg for an approximately 8 mm length of the device experimental section. Oxygen tension was estimated using fluorescent calibrations at 0 mm Hg and 160 mm Hg using the oxygen-sensitive dye Ru(bpy)3.

