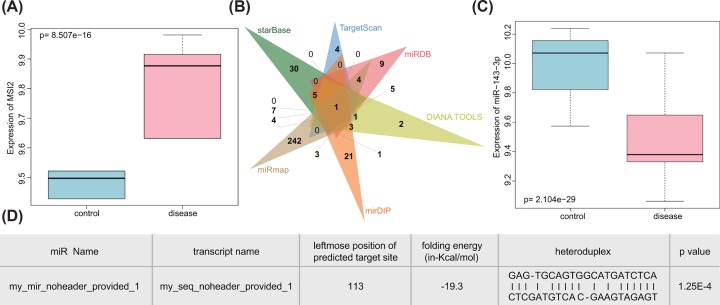
Figure 1. TC-related microarrays present dysfunction of LINC01296/miR-143-3p/MSI2 axis.
(A) The expression box diagram of MSI2 in the GSE66738 microarray where the blue box on the left showed the expression of normal samples, and the red box on the right showed the expression of TC samples; (B) the Venn map of upstream miRs of MSI2 predicted by starBase, TargetScan, miRDB, DIANA TOOLS, mirDIP and miRmap; (C) the expression box diagram of miR-143-3p in the GSE97070 microarray where the blue box on the left showed the expression of normal samples, and the red box on the right showed the expression of TC samples; (D) binding sites between miR-143-3p and LINC01296 obtained by lncLocator (P=1.25e-04).

