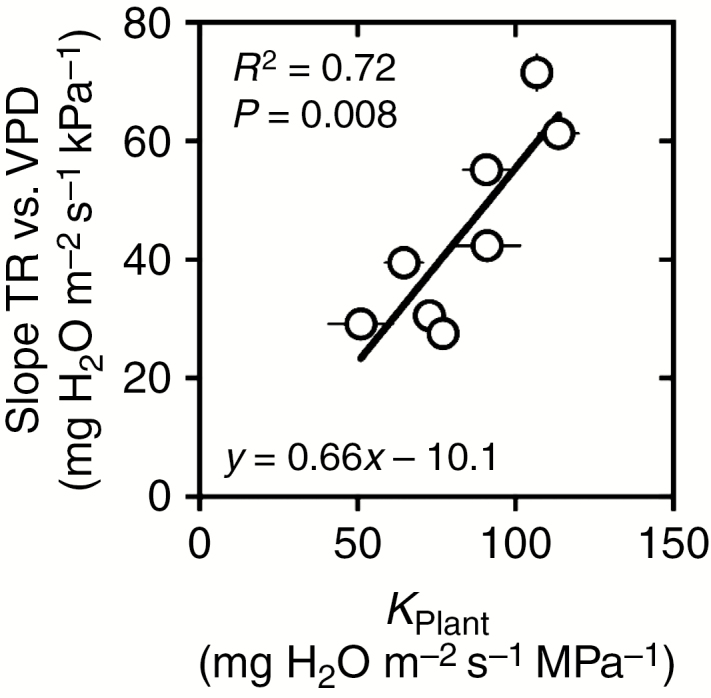
Fig. 2.

Relationship between the slope of the whole-plant transpiration rate (TR) response curve to increasing vapour pressure deficit (VPD) determined in Schoppach et al. (2016) and plant hydraulic conductance (KPlant) measured independently in experiment E1 on the eight wheat genotypes of the study.
