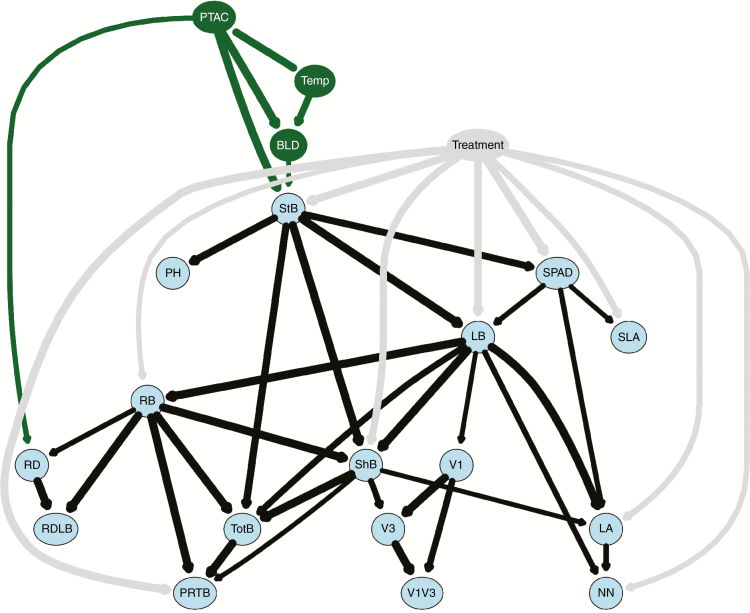
Fig. 6.
Average network analysis from cross‐validation by bootstrapping (10 000 iterations). The plot only includes nodes above the significance threshold and line thickness represents the strength of the relationship. Phenotypic traits are coloured in blue, environmental variables in green and the treatment node (well watered versus drought-stressed) in grey. Abbreviations are defined in the legend of Fig. 5.

