Fig. 1.
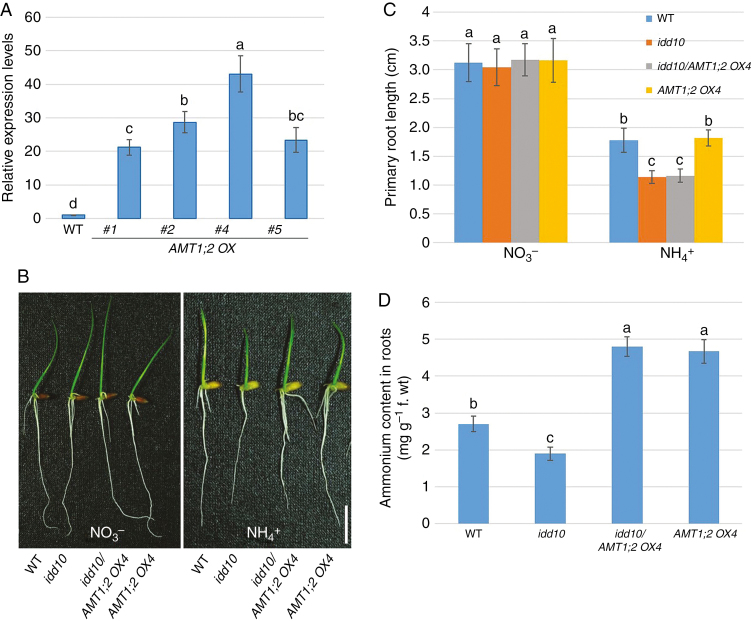
Root growth and cellular NH4+ content of wild-type, AMT1;2 OX, idd10 and idd10/AMT1;2 OX4 plants. (A) AMT1;2 expression levels in the wild type (WT) and four AMT1;2 overexpression lines (AMT1;2 OX; #1, #2, #4 and #5) were monitored using qRT–PCR. AMT1;2 mRNA levels in the samples were normalized against expression of UBIQUITIN. Data are means ± S.E. (n = 3). (B) Wild-type, idd10, idd10/AMT1;2 OX4 and AMT1;2 OX4 were grown for 4 d in half-strength KB nutrient solution containing either NO3– or NH4+ as the sole N source. Scale bar = 1 cm. (C) Primary root length measurements of the plants shown in (B). Data are means ± s.e. (n > 10 plants per line). (D) Cellular NH4+ levels in wild-type and mutant roots grown for 4 d in a nutrient solution containing NH4+ as the sole N source. Details of all nutrient media are in Supplementary data Table S1. Data are means ± s.e. (n > 10 plants per line); different letters indicate significant differences between results (P < 0.05).

