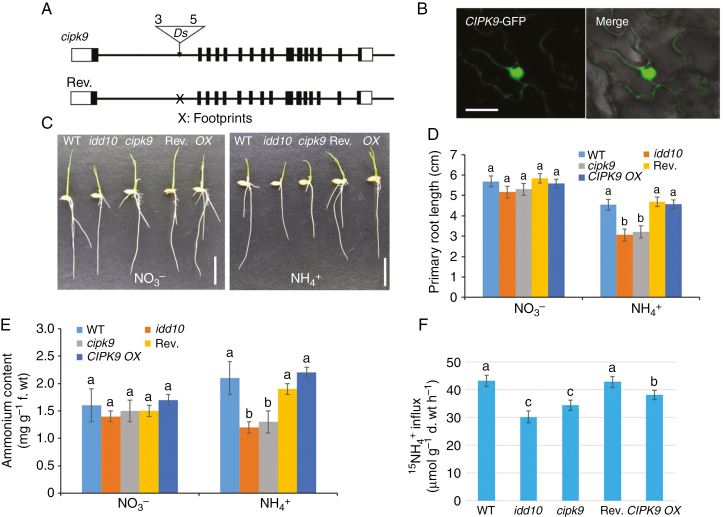
Fig. 7.
Gene structures of cipk9 and its revertant, sub-cellular localization of CIPK9, and N-responsive root growth, NH4+ content and 15NH4+ uptake in cipk9 and idd10 mutants. (A) Schematic diagrams showing the genomic structures of the cipk9::Ds insertion mutant and its revertant. Black boxes, exons; white boxes, untranslated regions. The triangle indicates the Ds insertion site; ‘3’ and ‘5’ indicate the 3′ and 5′ ends of Ds, respectively. Ds was excised from revertant plants leaving a footprint ‘X’ in the first intron. (B) Transient expression of CIPK9–GFP in Nicotiana benthamiana leaves. Left panel, confocal microscopy of green fluorescent protein (GFP); right panel, overlay of light microscopy image with GFP signal from the same tissue. Scale bars = 20 μm. (C) Appearance of wild-type (WT), idd10, cipk9, CIPK9 revertant (Rev.) and CIPK9 overexpressing (OX) seedlings after 4 d growth in nutrient solutions with either NO3– or NH4+ as the sole N source (Supplementary data Table S1). Scale bar = 1 cm. (D) Measurements of primary root lengths of plants grown as shown in (C) (n > 10 plants per line). (E) Endogenous NH4+ levels in roots of seedlings grown for 4 d in a nutrient solution with either NO3– or NH4+ as the sole N source (n > 10 plants per line). (F) Analysis of 15NH4+ influx into roots of wild-type, idd10, cipk9, Rev. and CIPK9 OX plants. Ammonium uptake into rice roots was determined following exposure to 200 μm15N-labelled NH4+. Data shown in (D) and (E) are means ± s.e.; data shown in (F) are means ± s.d. (n > 10 plants per line). In all cases, different letters indicate significant differences between results (P < 0.05).

