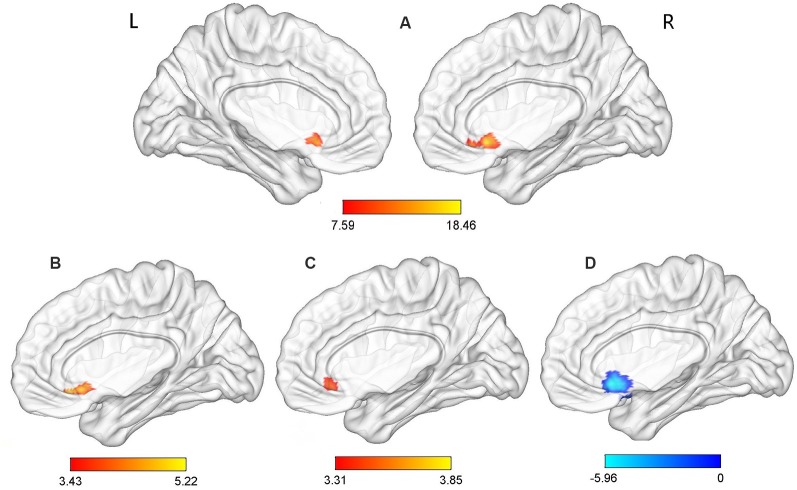
Figure 1.
Analysis of variance (ANOVA) and post hoc analysis results for regional homogeneity (ReHo). (A) ANOVA among three groups; (B) comparison between the tremor-dominant Parkinson’s disease with no sleep disorder (TDPD-NSD) and with sleep disorder (TDPD-SD) groups; (C) comparison between the healthy control (HC) and TDPD-SD groups; (D) comparison between the TDPD-NSD and HC groups; color bars indicate the t-score, with warm-colored areas representing brain regions where ReHo/functional connectivity (FC) values increased and cool-colored areas representing brain regions where ReHo/FC values decreased. R, right; L, left.

