Figure 4.
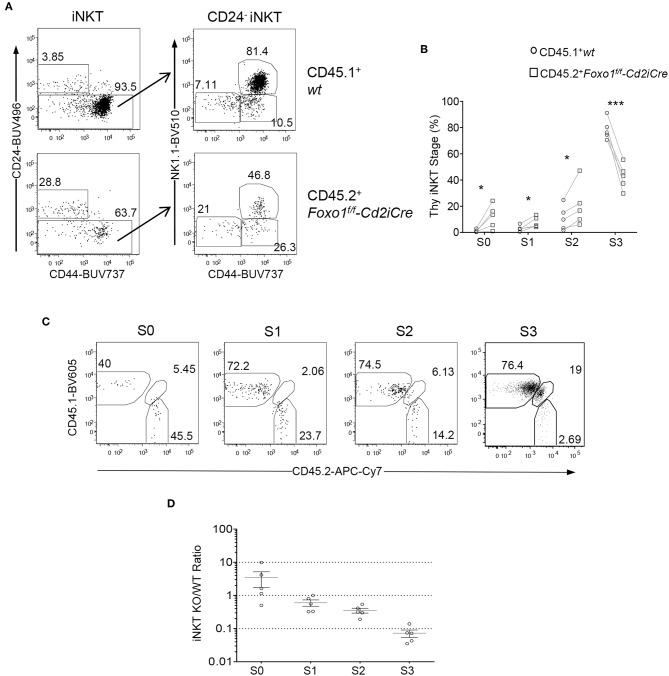
Intrinsic control of late stage iNKT cell development by Foxo1. Thymocytes and splenocytes and liver MNCs from mixed BM chimeric mice as described in Figure 2 were similarly analyzed. (A) Representative FACS plots showing CD24 and CD44 staining in live gated Lin-CD45.1+ WT and CD45.2+ Foxo1KO thymic iNKT cells (left panels) and CD44 and NK1.1 staining in the CD24− population of iNKT cells. (B) Scatter plots showing percentages of iNKT cell developmental stages. (C) Representative FACS plots showing CD45.1 and CD45.2 staining on stage 0–3 iNKT cells. (D) Scatter plots showing CD45.2/CD45.1 ratios of individual iNKT cell developmental stages. Connecting lines indicate CD45.1 WT and CD45.2 Foxo1KO iNKT cells in individual mice. One chimeric mouse was examined in each experiment. *p < 0.05; ***p < 0.001 determined by two-tail pair-wised Student t-test.

