Figure 5.
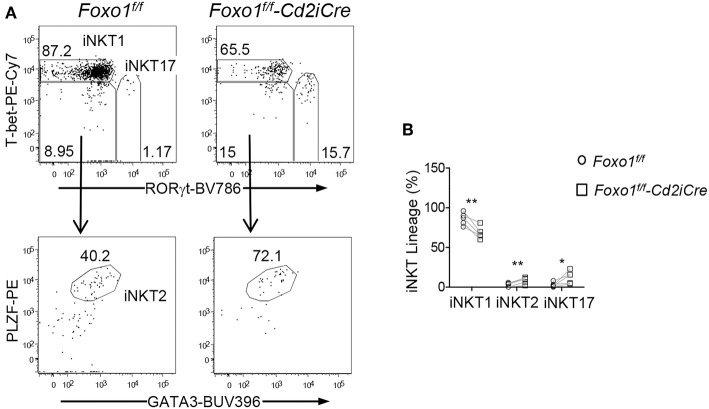
Selective impairment of iNKT1 differentiation in Foxo1 deficient mice. (A) Top panels: T-bet and RORγt staining of thymic iNKT cells. Bottom panels: PLZF and GATA3 staining of RORγt−T-bet− iNKT cells. (B) Percentages of iNKT effector lineages. Data shown are representative or pooled from five experiments. Connecting lines indicate individual pairs of sex- and age-matched test and control mice in each experiment. One pair of mice was examined in each experiment. *p < 0.05; **p < 0.01 determined by two-tail pair-wised Student t-test.

