Figure 3.
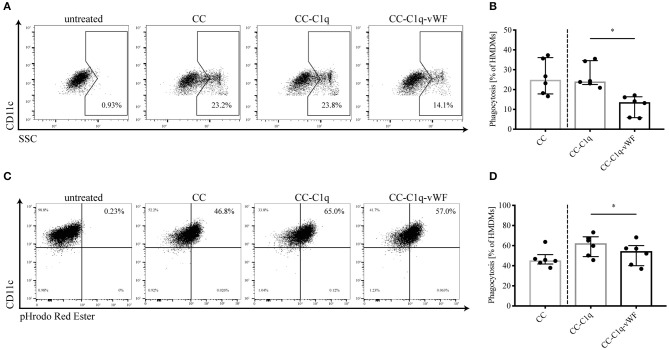
Phagocytosis of CC-C1q-vWF complexes by HMDMs is hampered. (A,B) HMDMs were kept untreated or treated with CC, CC-C1q or CC-C1q-vWF complexes for 18 h and analyzed by flow cytometry for the degree of phagocytosis of CC complexes. Phagocytosis was determined by the percentage of CD11c+ cells with a shift into the SSChigh gate. (A) Flow cytometry dot plots show one out of six independent experiments. (B) Quantification of phagocytosis for pooled data is shown. (C,D) HMDMs were treated with CC, CC-C1q or CC-C1q-vWF pHrodo-dyed complexes for 30 min and analyzed by flow cytometry for the degree of phagocytosis of CC complexes. Phagocytosis was determined by the percentage of CD11c+ cells with a shift into pHrodo Red Ester+ gate. (C) Flow cytometry dot plots show one out of six independent experiments. (D) Quantification of phagocytosis for pooled data is shown. Columns denote median while error bars indicate interquartile range. Data points represent independent experiments analyzing six different healthy donors used to obtain HMDMs (Wilcoxon matched pairs signed rank test, *p < 0.05).

