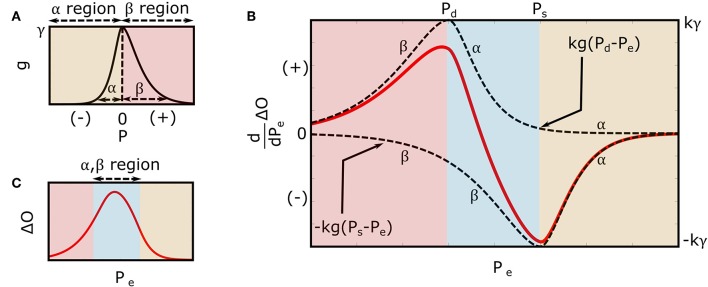
Figure 3.
Extended mathematical model of the oscillogram. (A) Parametric model of the arterial compliance curve [ in Equation (3)] that is physiologic and readily leads to formulas for explaining the oscillometric BP estimation algorithms of Figure 1. The model parameters α and β reflect the compliance curve widths over negative and positive transmural pressures, respectively, while γ denotes the compliance curve height. (B) Model of the derivative of the oscillogram (dO/dPe = kg(Pd − Pe) − kg(Ps − Pe)) obtained from the derivative of the model shown in Figure 2 and the arterial compliance curve model shown in (A). (C) Model of the oscillogram obtained by integrating the derivative model shown in (B).

