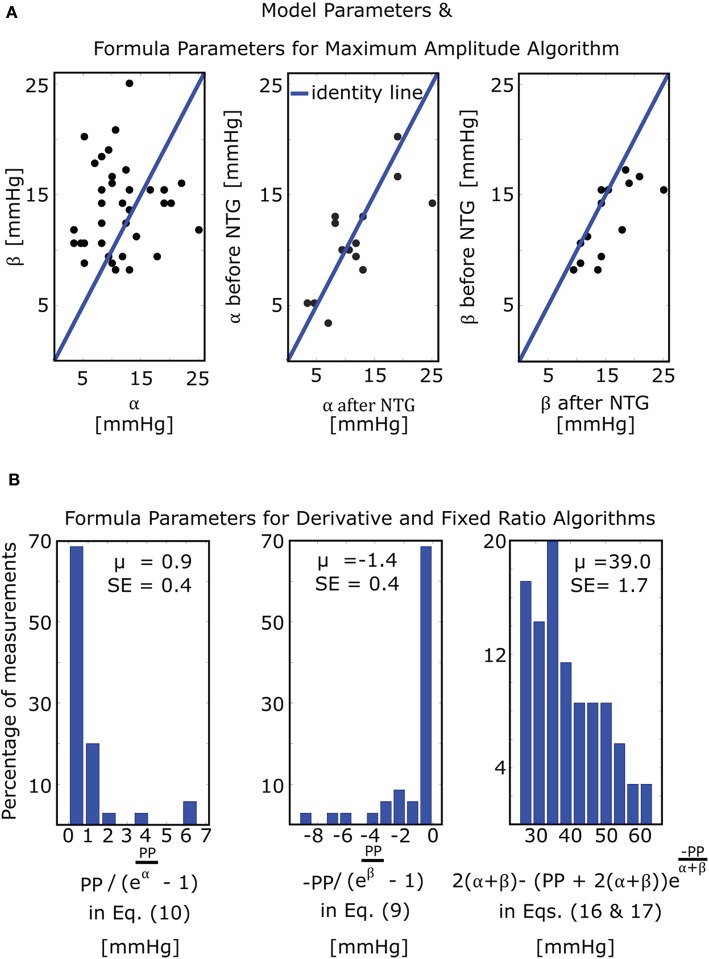
Figure 4.
Model and formula parameter values obtained by fitting the model of Figure 3C to measured oscillograms from patients (M = 35 measurements before and/or after nitroglycerin (NTG) from N = 21 patients). (A) Model parameters and formula parameters for the maximum amplitude algorithm [see Equation (7)]. The parameters α and β again reflect the arterial compliance curve widths over negative and positive transmural pressures, respectively (see Figure 3A). (B) Formula parameters for the derivative and fixed ratio algorithms. The two histograms on the left show the values of the BP errors in the formulas for the derivative algorithm [see Equations (9) and (10)], while the histogram on the right shows the values of the scale factor mapping ratio error to small BP error in the formulas for the fixed ratio algorithm [see Equations (16) and (17)]. PP, pulse pressure; μ, mean value; SE, standard error.

