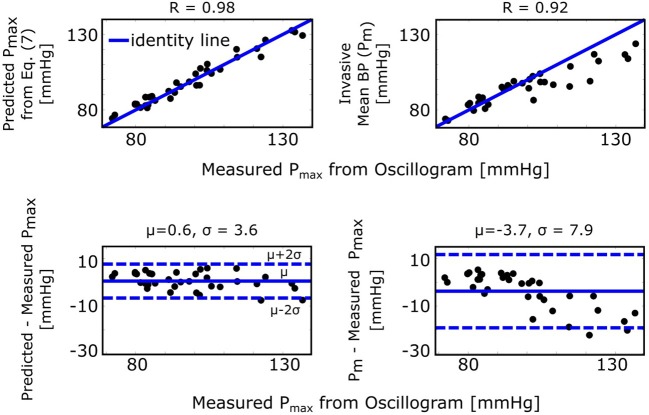
Figure 5.
Validation results for the formula for explaining the maximum amplitude algorithm [see Figure 1 and Equation (7)]. Correlation and Bland-Altman plots of Pmax (external pressure at which the oscillogram peaks) predicted by the formula vs. Pmax measured from the oscillogram via the maximum amplitude algorithm (left plots) and of invasive mean BP (Pm) vs. measured Pmax (right plots). R is the correlation coefficient; μ, mean of the errors (bias error); and σ, standard deviation of the errors (precision error).

