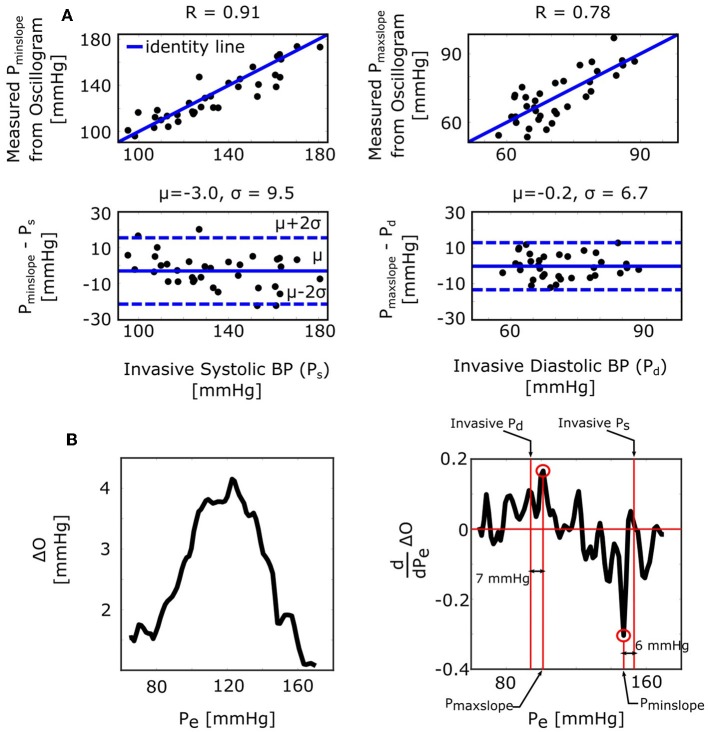
Figure 6.
Validation results for the formulas for explaining the derivative algorithm [see Figure 1 and Equations (9) and (10)]. (A) Correlation and Bland-Altman plots of Pmaxslope and Pminslope (external pressures at which the oscillogram has maximal and minimal slopes) measured from the oscillogram via the derivative algorithm vs. invasive diastolic BP (Pd) and invasive systolic BP (Ps). Consistent with the formula predictions, the bias errors are small. The appreciable precision errors are due to measurement noise, which is not considered by the formulas. (B) A representative oscillogram (before any filtering or model fitting) and its derivative illustrating the impact of typical high frequency measurement noise (due to, e.g., respiration, heart rate variability, and motion) on the correspondence between the detected Pminslope/Pmaxslope and Ps/Pd.

