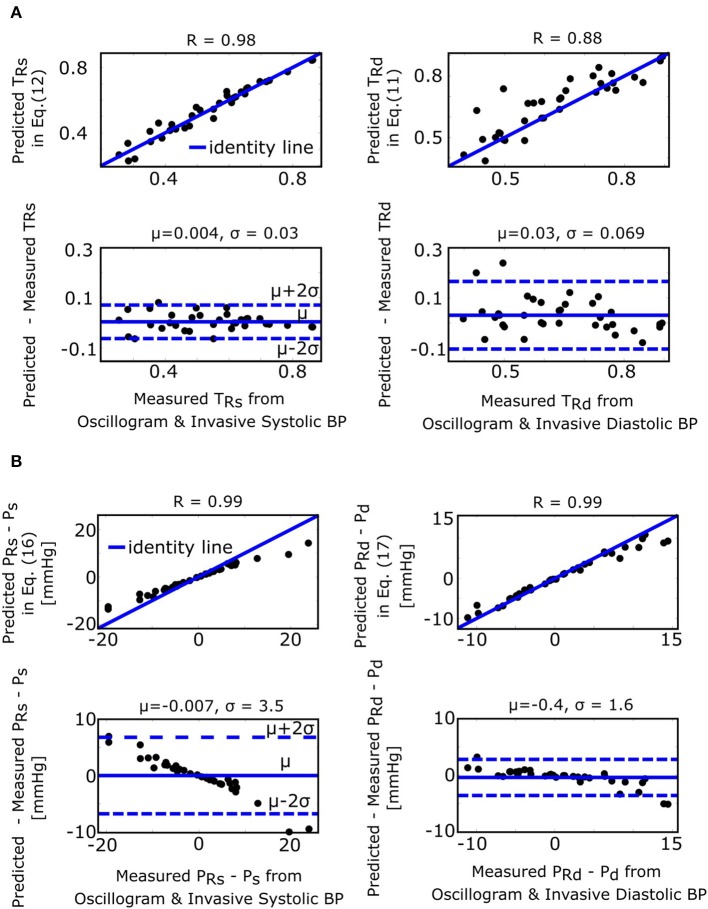
Figure 7.
Validation results for the formulas for explaining the fixed ratio algorithm (see Figure 1). (A) Correlation and Bland-Altman plots of TRs and TRd (true systolic and diastolic ratios, i.e., the ratios of the oscillogram evaluated at the actual BP levels) predicted by the formulas of Equations (11) and (12) vs. TRs and TRd measured by evaluating the oscillogram at invasive systolic BP and diastolic BP. (B) Analogous plots of PRs − Ps and PRd − Pd (BP errors of fixed ratio algorithm) predicted by the small error formulas of Equations (16) and (17) vs. PRs − Ps and PRd − Pd measured as the difference between the BP estimates via application of the fixed ratio algorithm (with ratios given by the average of the measured TRs and TRd over all the patients) to the oscillogram and the invasive BP values.

