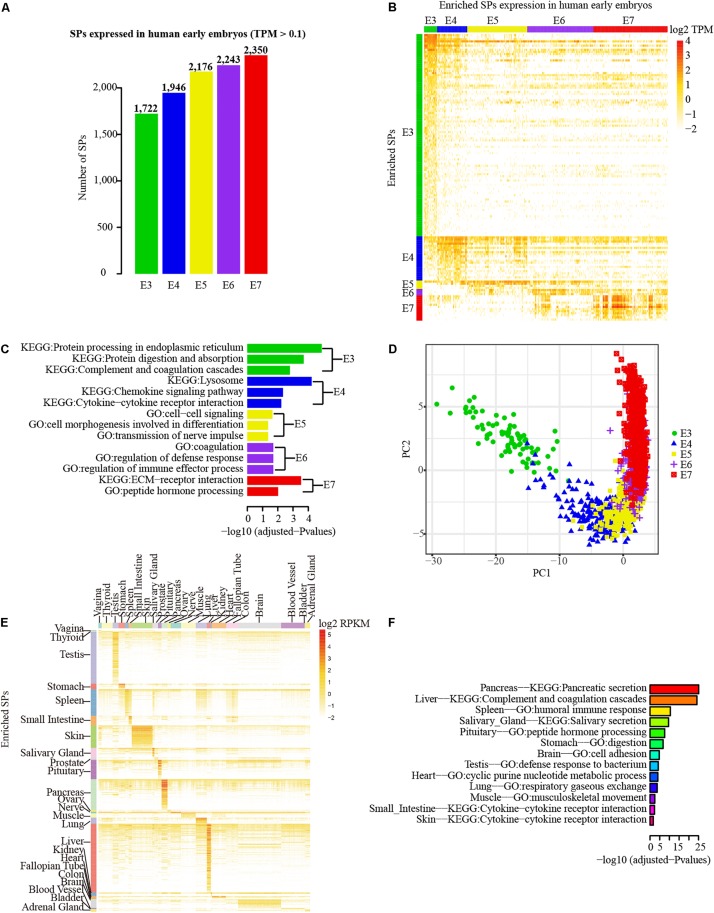
FIGURE 4.
Transcriptional profiles of SPs in early embryos and different tissues. (A) Number distribution of detected SPs in each embryonic stage (0.1 TPM as cutoff). (B) Principal Component Analysis (PCA) of the samples different embryonic stages based on the SPs with enriched expression in each stage. (C) The SP genes that with enriched expression in each embryonic stage. (D) Functional enrichment analysis (GO and pathway) of expression enriched SP genes in different embryo stage. Green, blue, orange, purple and red separately represent stages from E3 to E7. (E) Expression enriched SP genes in different tissues of GETx project. (F) Functional enrichment analysis (GO and pathway) of expression enriched SP genes in different tissues.

