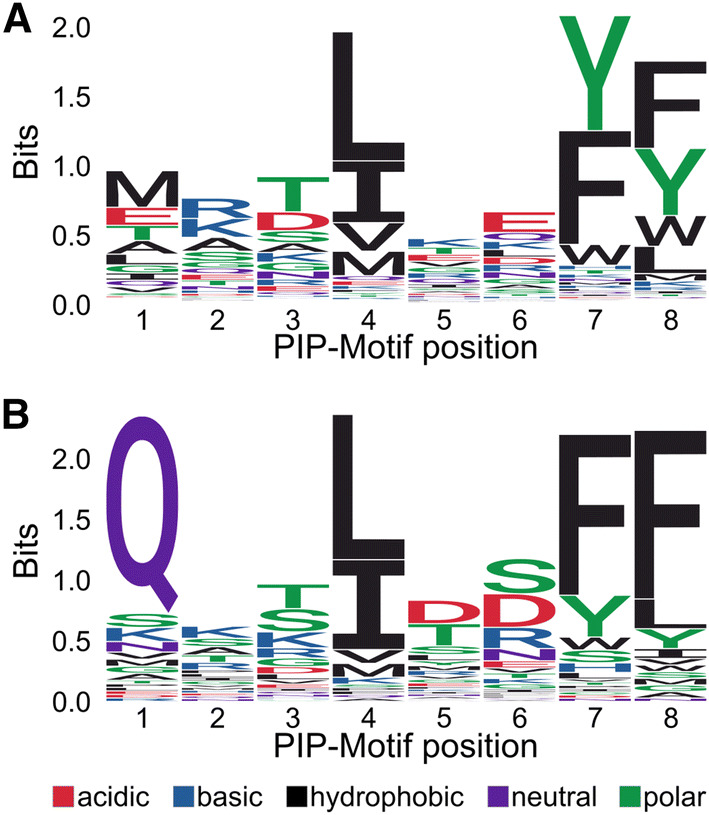
Fig. 4.

Structure analyses of the PCNA binding pockets across species. a Sequence logo of the amino acid distribution predicted by the structural model (letter-height denotes information content). b Sequence logo of the amino acid distribution calculated from motifs in Table 2 (letter-height denotes information content)
