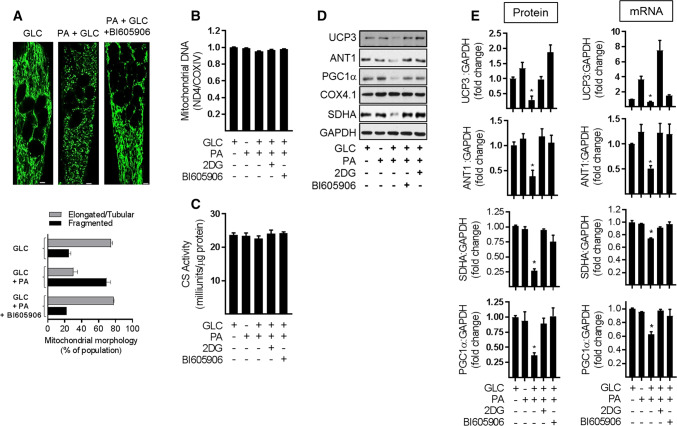
Fig. 7.
Effect of suppressing NFkB activation in response to cellular fuel overloading on mitochondrial morphology, mitochondrial proteins and gene expression. L6 myotubes were incubated with GLC (5 mM), PA (0.4 mM), 2DG (5 mM) and BI605906 (10 μM) for 16 h in the combinations indicated in the various experimental data panels prior to a analysis and quantification of mitochondrial morphology using Mitotracker green (Mitospy) by confocal microscopy (the scale bar represents 5 μm), b mitochondrial DNA copy number by qPCR, c citrate synthase (CS) activity and (d, e), analysis of mitochondria protein and mRNA abundance (UCP3, ANT1, PGC1α, SDHA, and COX4.1) which was normalised to GAPDH. All graphical bar data are presented as mean ± SEM from four separate experiments. Asterisks indicate a significant change (P < 0.05) to the GLC alone condition

