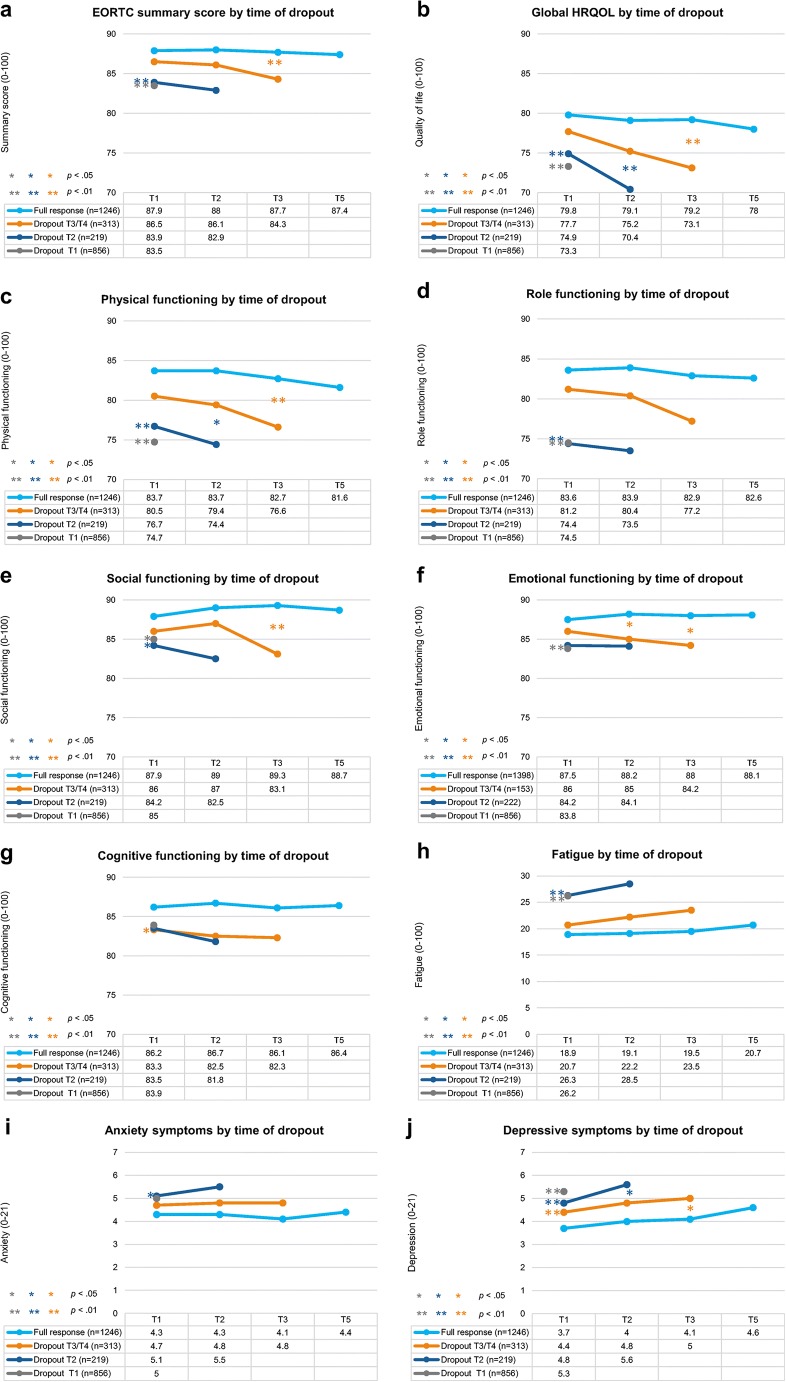
Fig. 1.
Unadjusted mean functioning scores on the EORTCQLQ-C30 (a– h) and anxiety and depressive symptoms on the HADS (i, j) according to time of dropout (range: 0–100 and 0–21, respectively). Note: EORTC QLQ-C30 scales range from0 to 100; higher scores reflect better perceived HRQOL. HADS scales range from 0 to 21; higher scores reflect higher prevalence of anxiety and depressive symptoms. p values indicate significant group differences between slopes and baseline scores compared with full responders in multilevel mixed models adjusted for time, age, sex, socioeconomic status, education, marital status, comorbidity, disease stage, and treatment received

