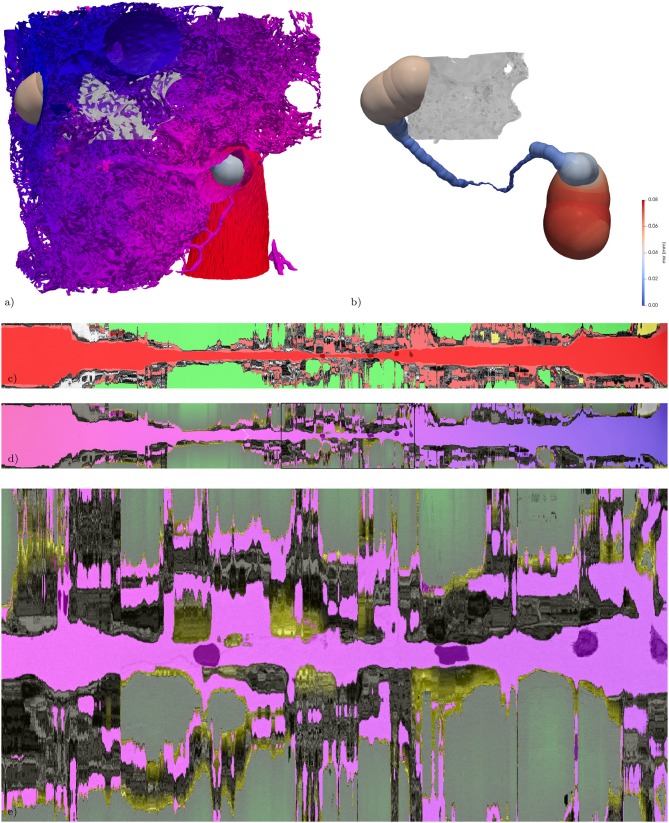
Figure 7.
Extracted path from artery to vein and corresponding straightened reformatted volumes (SRVs). (a) Surface of the vasculature (as in Figure 1c) combined with a rendering of the maximum-inscribed spheres (ms) along the extracted path. In addition the subregion from Figure 3 is volume rendered in gray-scale. (b) Same as (a) without the vasculature, revealing the full path indicated by its ms which are colored according to their radius (msr). The path is about 1.2 mm long and the maximum msr along the path is about 76 μm and the minimum msr about 1 μm. (c) The SRV of the original data (gray) is overlaid by the segmentation (semi-transparent, air: green; blood: red; lymph: yellow, other: magenta) in addition the voxelization of the locally maximum inscribed spheres is overlaid again in semi-transparent red, giving an indication of local divergence from circular cross-sections. The two RBCs used as way-points for the path extraction are visible as darker spots covered by semi-transparent red along the center line. (d) The SRV of the original data (gray) is overlaid by the V-A-fm, a-dm, and t-dm datasets. V-A-fm indicating the distance from the artery to the vein, ranging from red over magenta to blue; a-dm the shortest diffusion distance in the air space towards the surface of the tissue [green (> 50 μm) to black (0 μm)]; t-m the shortest diffusion distance from the surface of the tissue to the blood vessels [yellow (0 μm) to black (> 3 μm)]. (e) ACN region marked with a rectangle in (d).

