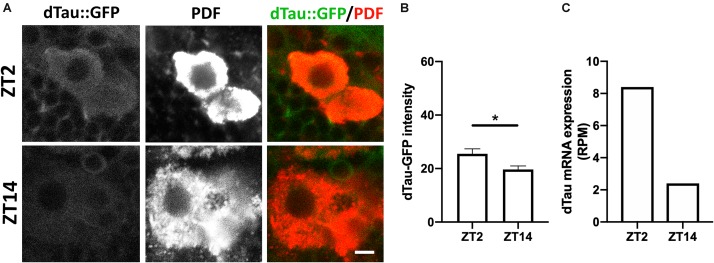
FIGURE 5.
Modulation of tau protein levels during daily rhythms. (A) Representative images of immunolabeled 7 day-old male dTau-GFP fly brains with anti-PDF antibody at ZT-2 and ZT-14 (early morning and early night time-points). Scale bar is 10 μm. (B) Plot representing absolute intensity values of dTau-GFP signal in LNv somas at ZT-2 and ZT-14. Results demonstrate a significant difference between dTau fluorescent signal at the studied Zeitgeber times, with intensity values higher at ZT-2 and lower at ZT-14. (C) Plot representing dTau mRNA levels resulting from PDF neurons RNA-seq analysis (Abruzzi et al., 2017). Results demonstrate a reduction in dTau transcript levels at ZT-14 in PDF neurons when compared to dTau mRNA levels at ZT-2. Data represent mean and SEM analyzed by non-parametric Mann–Whitney statistical test (∗p < 0.05; n = 12–14 hemispheres).

