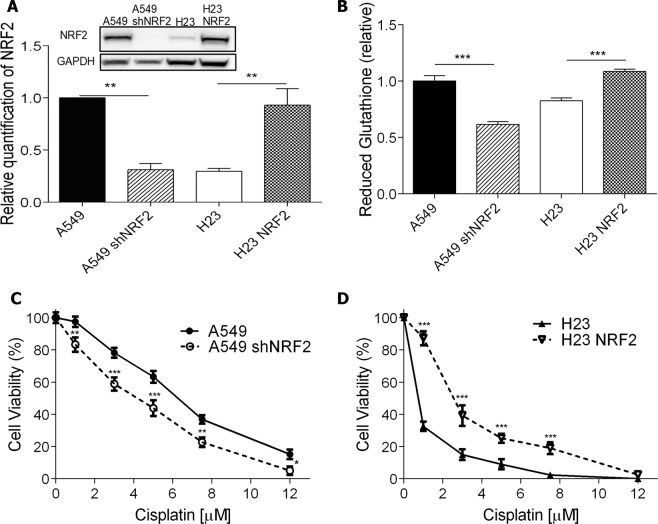
Figure 5.
Cellular response of NRF2 silenced or overexpressed cells to cisplatin treatment. (A) NRF2 protein level detection and relative quantification by western blot in A549 cells parent or transduced with shNRF2 lentivirus recombinant vector (A549 shNRF2), and H23 cells parent or transduced with NRF2 overexpression lentivirus recombinant vector (H23 NRF2). Full-length membranes are shown on Supplementary Fig. S7. (B) Quantification of basal intracellular reduced glutathione in the different cell lines (C,D) Dose-response curves of A549 and A549 shNRF2 (C) and H23 and H23 NRF2 (D) cell lines treated with increasing concentrations of cisplatin and analyzed after 72 h of treatment by XTT assay. Values are mean ± SEM of three independent experiments (two for the western blot experiments), *P < 0.05, **P < 0.01, ***P < 0.001.

