Figure 1.
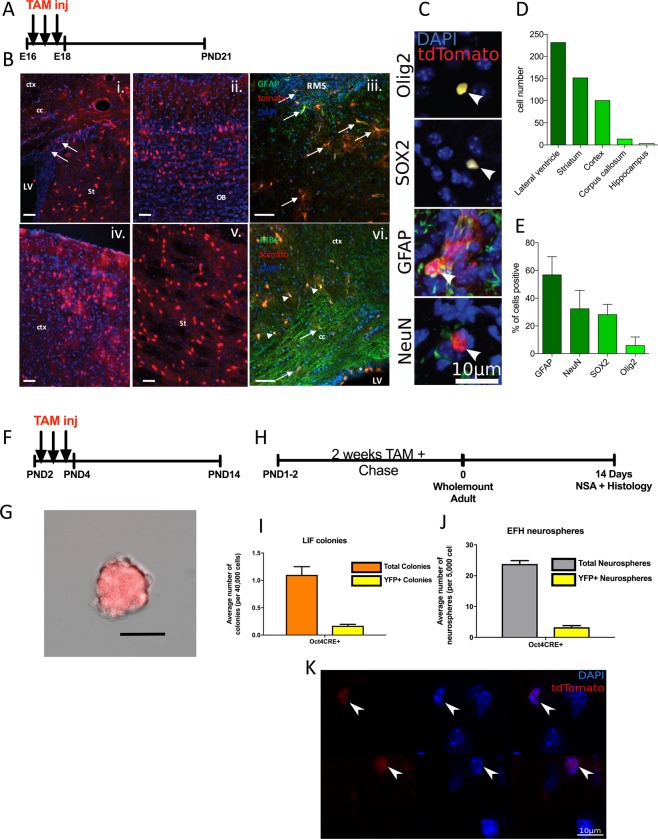
Identification of pNSCs in the developing and adult forebrain. (a) Schematic of the experimental paradigm for labeling Oct4 + pNSCs during embryogenesis (E16-18). (b) Sections showing tdTomato+ cells (red) throughout the brain of PND21 mice in (i) the germinal zone adjacent to the lateral ventricles (LV), (ii) olfactory bulb (OB), (iii) rostral migratory stream (RMS) with adjacent cells co-localized with GFAP (green; arrows), (iv) the cortex (ctx), (v) the striatum (St), and (vi) the corpus callosum (cc, arrow) and cortex (ctx, arrowhead) co-localized with the marker for MBP (green). Scale bars = 50 µm. blue = Hoescht. (c) High magnification, confocal images of all lineages identified at PND21 that co-localize with tdTomato+, pNSC derived cells including oligodendrocytes (Olig2), undifferentiated progenitors (Sox2), astrocytes (GFAP), and neurons (NeuN). (d) Regionalization of tdTomato+ cells throughout the brain. (e) Relative percentage of various cell types within the tdTomato+ cells located in the PND21 brains. (f) Schematic of experimental paradigm for labeling Oct4 + pNSCs during early post-natal period (PND2-4). (g) Representative image of a TdTomato+ LIF colony at PND14 following early post-natal labeling. Scale bar = 50 µM. (h) Schematic of experimental paradigm for labeling pNSCs postnatally. (i) At 4 weeks post-TAM the numbers of pNSCs (LIF) (orange bars) and co-expressing YFP+ neurospheres is indicated in yellow bars (n = 5 mice/group). (j), At 4 weeks post-TAM the total numbers of dNSCs (grey bars) and co-expressing YFP+ neurospheres (yellow bars) was assessed (n = 5 mice/group). (k) Wholemount of the lateral ventricles at 2 weeks post-TAM induction. Arrowheads indicate Tdtomato+ cells. Blue = DAPI, Red = Tdtomato. All data represents mean ± SEM.

