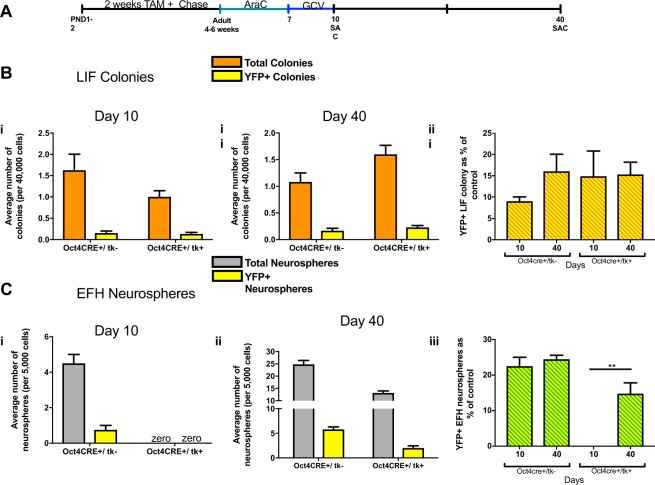
Figure 4.
Oct 4 expressing, primitive NSCs give rise to dNSCs following ablation. (a) Schematic of the experimental paradigm. (b) The colony-forming assay for pNSCs (LIF) (orange bars) was performed in control (Oct4CRE+/tk−) and experimental mice (Oct4CRE+/tk+) at day 10 (i) or day 40 (ii). The numbers of YFP+ colonies are indicated in yellow bars. Day 10, n = 3 Oct4CRE/tk- mice, n = 5 Oct4CRE/tk+ mice; Day 40, n = 5 mice/group. (c) The numbers of dNSCs (EFH) (grey bars) in control (Oct4CRE+/tk−) and experimental groups (Oct4CRE+/tk+) are assessed at day 10 (i) or day 40 (ii). The numbers of YFP+ neurospheres are indicated in yellow bars. Day 10, n = 3 mice/group for day 10; Day 40, n = 3 Oct4CRE/tk- mice, n = 5 Oct4CRE/tk + mice. All data represent mean ± SEM.

