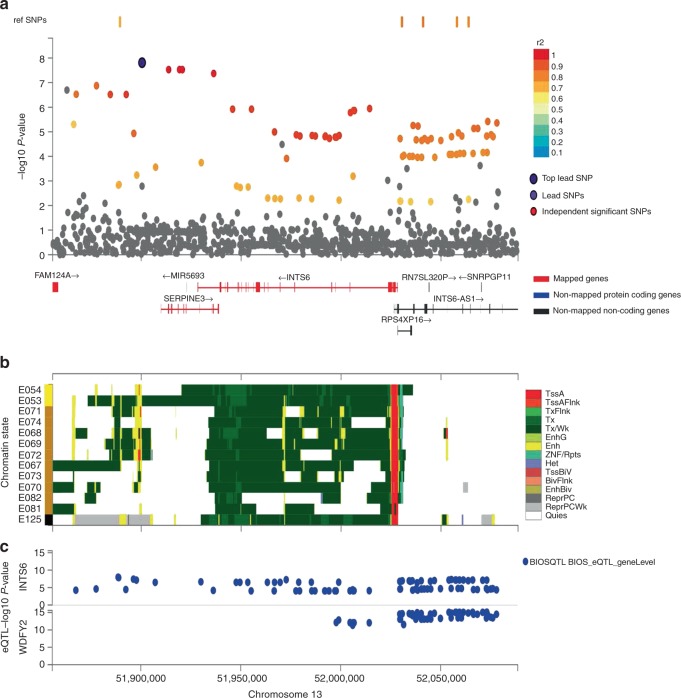
Fig. 4.
Regional, chromatin state and eQTL plot for rs1028727 (SERPINE3). Panel a shows the regional assocaiations plots with −log10 p value depicted on the y-axis, genes mapped by either position, eQTL or chromatin interaction are depicted in red on the x-axis; panel b shows 15 core chromatin states of varaints plotted in panel a for 13 brain tissues from Roadmap epidenomes described on the y-axis. E054 ganglion eminence derived primary cultured neurospheres, E053 cortex-derived primary cultured neurospheres, E071 brain hippocampus middle, E074 brain substantia nigra, E068 brain anterior caudate, E069 brain cingulate gyrus, E072 brain inferior temporal lobe, E067 brain angular gyrus, E073 brain dorsolateral prefrontal cortex, E070 brain germinal matrix, E082 fetal brain female, E081 fetal brain male, E125 NH-A astrocytes primary cells. Panel c depicts varaints that overlap eQTLs from selected eQTL databases described in the legend of panel (c).

