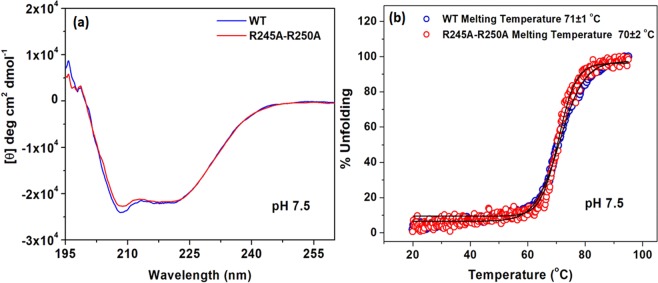
Figure 7.
CD spectra of WT NhaA and mutant R245A-R250A. The respective proteins (4 µM) were affinity-purified and re-suspended in dialysis buffer titrated to pH 7.5 with Tris base. The CD spectra were recorded on a JASCO J-810 CD Spectro-polarimeter (JASCO, Inc., Japan), using the supplied Spectra Manager software. (a) Comparison of CD spectra for the WT and mutant R245A-R250A at 4 °C. (b) Unfolding transition midpoint (Tm) values were determined from the corresponding inflection points. Traces are representative from three different measurements.

