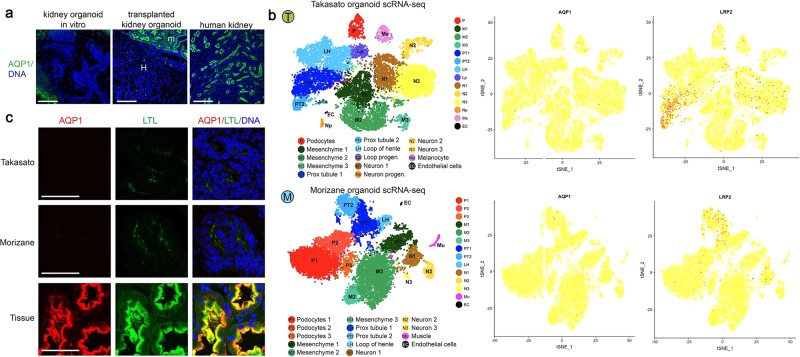
Fig. 5. Aquaporin-1 expression is negligible in kidney organoids from different protocols.
a Representative confocal fluorescence images of AQP1; M, mouse kidney; H, human graft. Scale bars, 100 μm. b t-SNE dot plots showing clusters of kidney organoid cells generated using either the Takasato (T, top) or Morizane (M, bottom) method, analyzed by single cell RNA-seq. c Confocal optical sections of organoids derived using these protocols or human kidney tissue, using identical laser power and gain settings for AQP1 and LTL channels. Images are representative of three different batches of organoids for each protocol. Scale bars, 50 µm.

