Fig. 6.
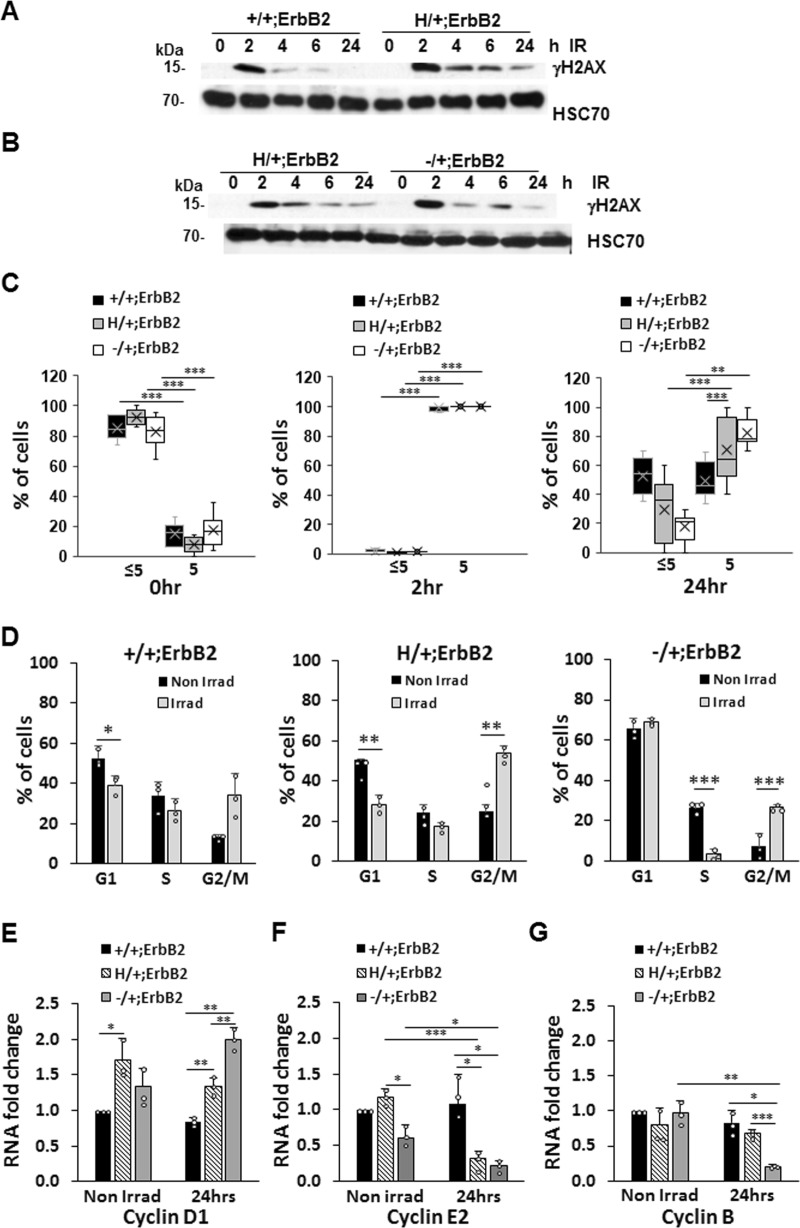
Cells with mutant p53 have defect both in DNA-damage repair response and in cell-cycle profile following γ-irradiation (a, b) Western blot of γH2AX level (representing DNA damage) post-irradiation (9 Gy, single dose) showing γH2AX efficient resolution in p53+/+;ErbB2 cells (a) but is sustained up to 24 h in p53H/+;ErbB2 and p53−/+;ErbB2 cells (b). HSC70 as a loading control. c Quantification of cells with >5 and <5 γH2AX foci/cell in p53+/+;ErbB2, p53H/+;ErbB2, and p53−/+;ErbB2 cell lines, before and after γ-irradiation (9 Gy, 2 and 24 h post-irradiation). d Aberrant cell-cycle checkpoint following γ-irradiation in p53H/+;ErbB2 cells. Bar graphs showing cell-cycle analysis of p53+/+;ErbB2, p53H/+;ErbB2, and p53−/+;ErbB2 cell lines irradiated (gray bars) or not (black bars). e, f QRT-PCR 24 h post-irradiation is showing the impact of a single dose of γ-irradiation (9 Gy) on the transcription of Cyclin D1 (e), Cyclin E2 (f), Cyclin B (g). Level of transcripts was quantified relatively to HPRT. n = 3 independent experiments. *p < 0.05; **p < 0.01; ***p < 0.001. Error bars represent ± SD.

