
Fig. 1. Quantification of the percentages of neurons and dopaminergic neurons obtained from different hiPSC lines using pharmacological compounds.
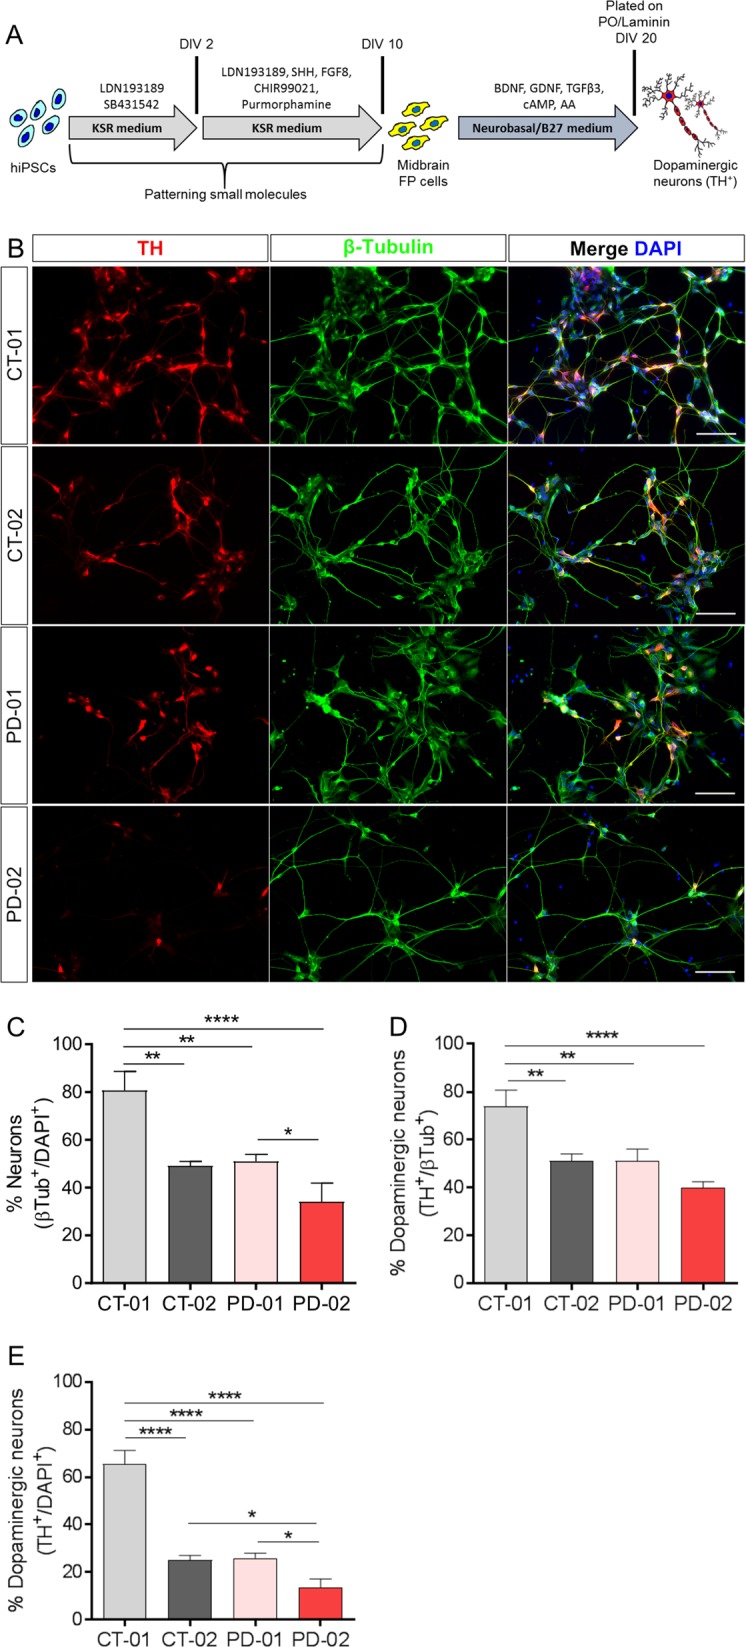
a Schematic representation of the use of pharmacological compounds to pattern hiPSCs to generate TH+ dopaminergic neurons at DIV 25. The patterning protocol consists of inhibiting SMAD signaling and activating SHH and WNT signaling to obtain midbrain floor-plate precursors by DIV 11. These cells in the presence of growth factors mature into TH+ dopaminergic neurons. b Representative fluorescence images of immunoreactivity for the dopaminergic neuronal marker TH (red) and the pan-neuronal marker β-Tubulin (green) at DIV 25. Nuclei are counterstained with DAPI (blue). Scale bars: 100 µm. c Quantitative analysis of the percentage of neurons obtained after patterning with pharmacological compounds. Data represent the average percentage of neurons of total cell numbers in culture (β-Tubulin+/DAPI+). *p < 0.05; **p < 0.01; ****p < 0.0001, one-way ANOVA followed by Bonferroni’s post-hoc test. d Quantitative analysis of total percentage of dopaminergic neurons obtained after patterning with pharmacological compounds. Data represent the average percentage of total dopaminergic neurons out of all neurons in culture (TH+/β-Tubulin+). **p < 0.01; ***p < 0.001, one-way ANOVA followed by Bonferroni’s post-hoc test. e Quantitative analysis of total percentage of dopaminergic neurons obtained after patterning with pharmacological compounds. Data represent the average percentage of total dopaminergic neurons out of all cells in culture (TH+/DAPI+). *p < 0.05; ****p < 0.0001, one-way ANOVA followed by Bonferroni’s post-hoc test. In all graphs, bars represent the average percentage ± SD from at least three independent differentiations for each of the four hiPSC lines.