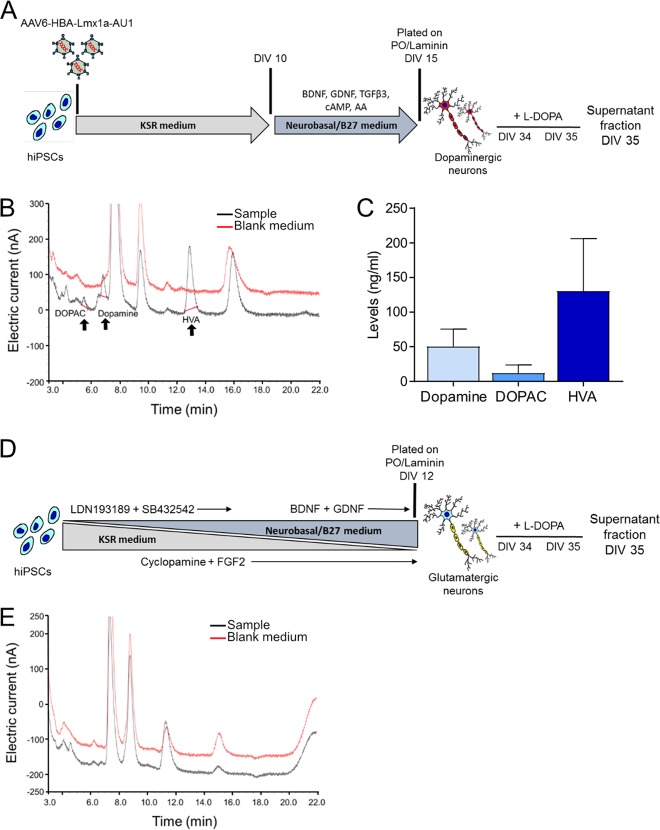
Fig. 5. hiPSC-derived neurons release dopamine and its metabolites after treatment with L-DOPA.
a Experimental design to detect the release of dopamine in CT-01 hiPSC-derived neurons at DIV 35. Neurons were treated with L-DOPA at DIV 34 and DIV 35 with the supernatant collected 4 h later (i.e. at DIV 35). b, c Representative HPLC chromatogram (b) and quantitative analysis (c) of released dopamine, DOPAC and HVA in hiPSC-derived dopaminergic neurons patterned using transcription factor rLmx1a. The black and red lines in the chromatogram (b) represent supernatant of the sample and matched blank medium (without cells), respectively. d Experimental design to detect released dopamine in CT-01 hiPSC-derived glutamatergic neurons at DIV 35. Patterning was performed using SMAD inhibitors LDN/SB along with cyclopamine and FGF2. Neuronal cells were plated on DIV 12 in the presence of growth factors like BDNF and GDNF. Similarly, these neurons were treated with L-DOPA at DIV 34 and DIV 35, with the supernatant collected 4 h later (i.e. at DIV 35). e Representative HPLC chromatogram with no detectable levels of dopamine, DOPAC and HVA observed in the supernatant of hiPSC-derived glutamatergic neurons at DIV 35. The black and red lines in the chromatogram (e) represent supernatant of the sample and matched blank medium (without cells), respectively. The other unspecific peaks present in the chromatogram (b, e) arise due to the neurobasal medium composition.

