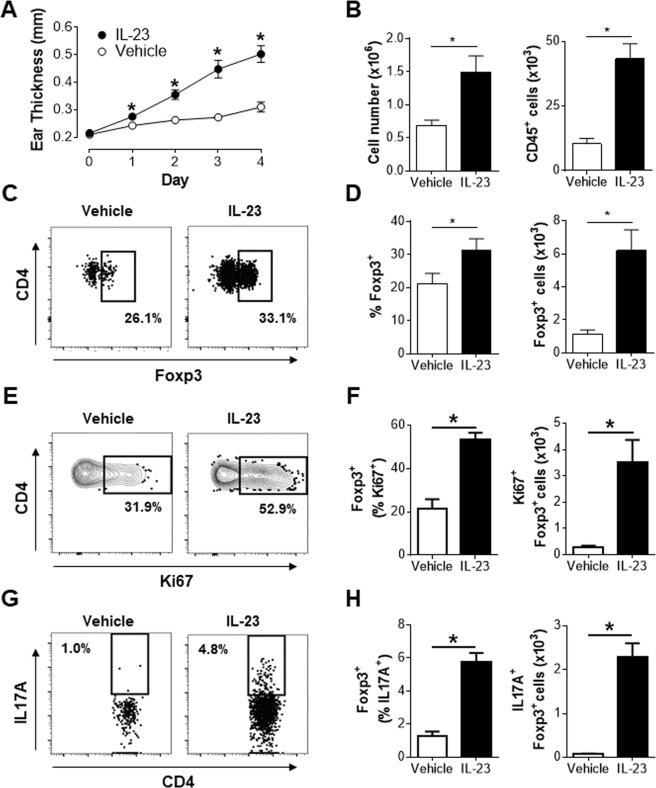
Figure 1.
IL-23 induced inflammation drives accumulation of Tregs. Animals received four daily intradermal (ear) injections of vehicle or IL-23 (days 0–3) and were analyzed on day 4. (A) Measurement of ear thickness. (B) Total cellularity and number of CD45+ cells in the ear. (C) Representative flow cytometry plots of live CD45+CD4+TCRβ+ cells in the ear. (D) Frequency and number of Foxp3+ (live CD45+CD4+TCRβ+Foxp3+ cells) in the ear of mice. (E and G) Representative flow cytometry plots of Foxp3+ cells in the ear. (F and H) Frequency and number of the indicated cell populations in the ear. (A) Representative data of at least 3 independent experiments, n = 4. (B–F) Pooled data from two independent experiments, n = 8. (G and H) Data represents pooled analysis of 2 vehicle or IL-23 treated ears. Representative data from two independent experiment, at least n = 3 in each experiment. Live CD45+CD4+TCRβ+Foxp3+ cells in the ear are defined as Foxp3+ cells in the figure. *p < 0.05 determined by student’s t test.

