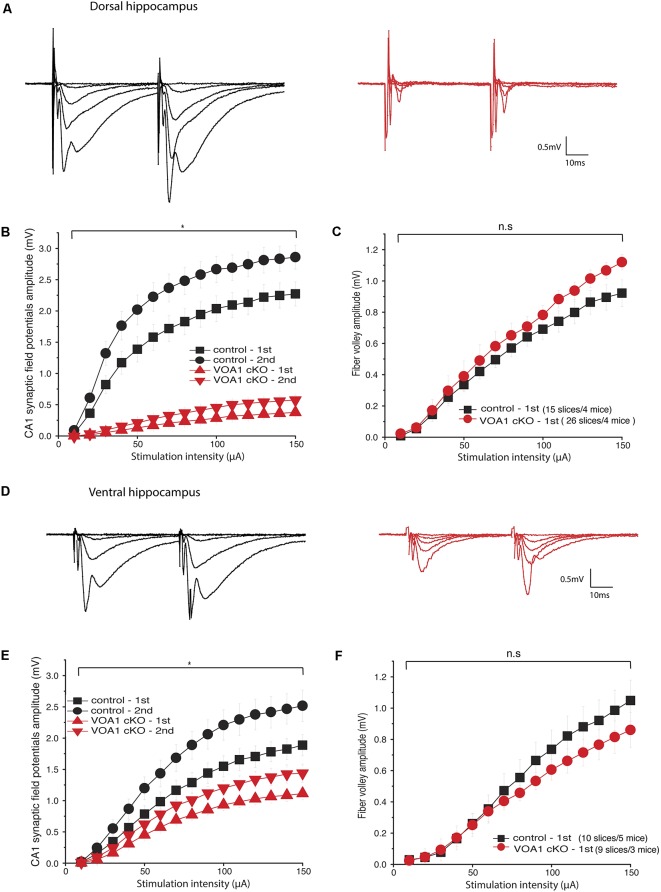
Figure 2.
CA1 synaptic field potentials diminished in the Voa1 cKO mice. (A,D) Representative traces were collected from the Voa1 cKO mice and the control mice. Dorsal (A) and ventral (D) CA1 synaptic field potentials were evoked by paired stimulations of the Shaffer collateral pathway at intensities of 10, 20, 30, 50 or 150 μA, respectively. (B,E) The amplitudes of 1st and 2nd CA1 field potentials were plotted vs. stimulation intensities. (C,F) The amplitudes of presynaptic volleys were plotted vs. stimulation intensities. The synaptic field potentials (B,E), but not the presynaptic volleys (C,F), were significantly different between the Voa1 cKO mice and control mice (Mixed repeated ANOVA; see details in “Results” section).

