Figure 4.
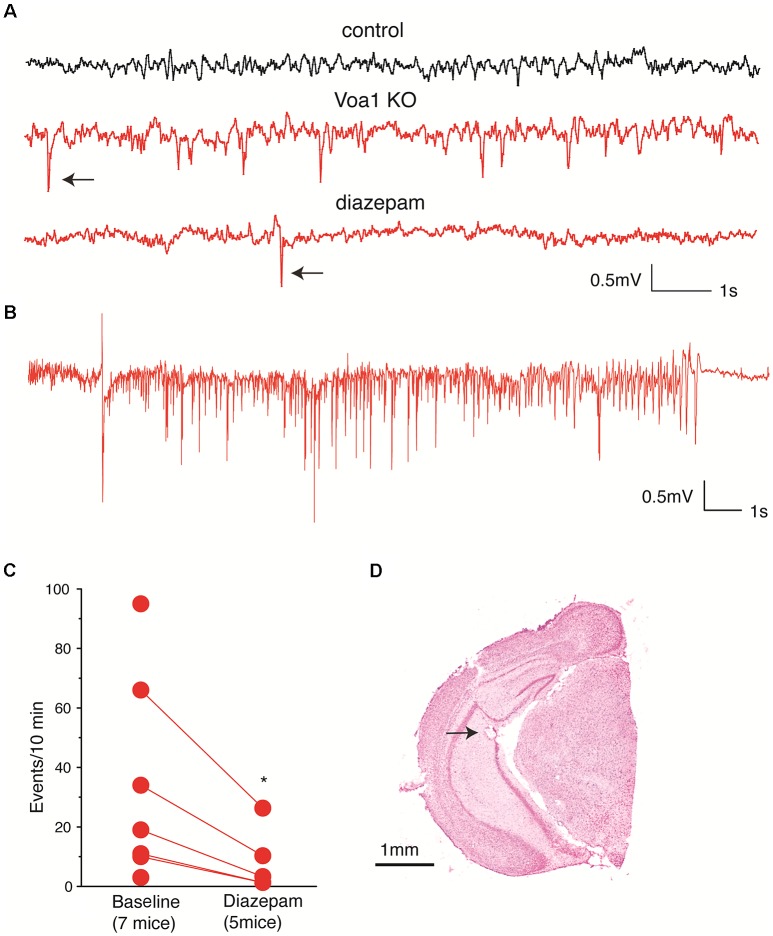
Aberrant CA3 electroencephalographic (EEG) activities observed from the Voa1 cKO mice. (A) Representative CA3 EEG traces collected from a control mouse and a Voa1 cKO mouse. Examples of spikes were denoted by filled arrows. Note multiple spikes and a single spike recorded from the Voa1 cKO mouse before and about 2 h following diazepam injection. (B) An episode of CA3 discharge collected from another Voa1 cKO mouse. (C) Spike rates (events/10 min) measured from seven Voa1 cKO mice. Data collected from five of the seven mice following saline (baseline) and diazepam injections were linked by solid lines. Note a significant decrease in spike rate following the diazepam injections (paired t-test). (D) A representative cresyl violet-stained section showing the track and putative tip location (filled arrow) of an implanted hippocampal electrode.

