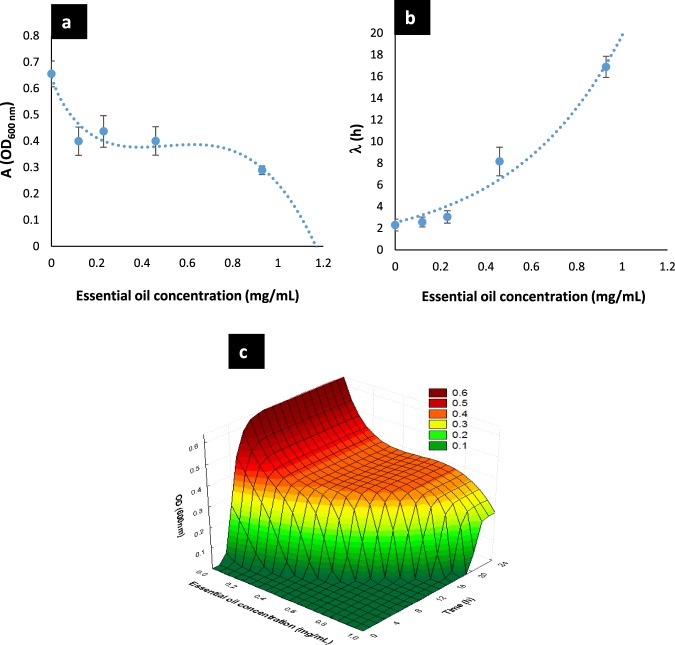
Figure 3.
Parameters A (a) and λ (b) of the modified Gompertz model (Eq. (6)) to E. coli U21 as function of the BOT concentration. The dots are the experimental values; the vertical bars are the standard deviation and the curves are the model of Eqs. (1) and (2), respectively. (c) General model that describes the bacterial culture density of E. coli U21 as function of the time of treatment and the BOT concentration applied (Eq. (4)). BOT = Brazilian orange terpenes.

