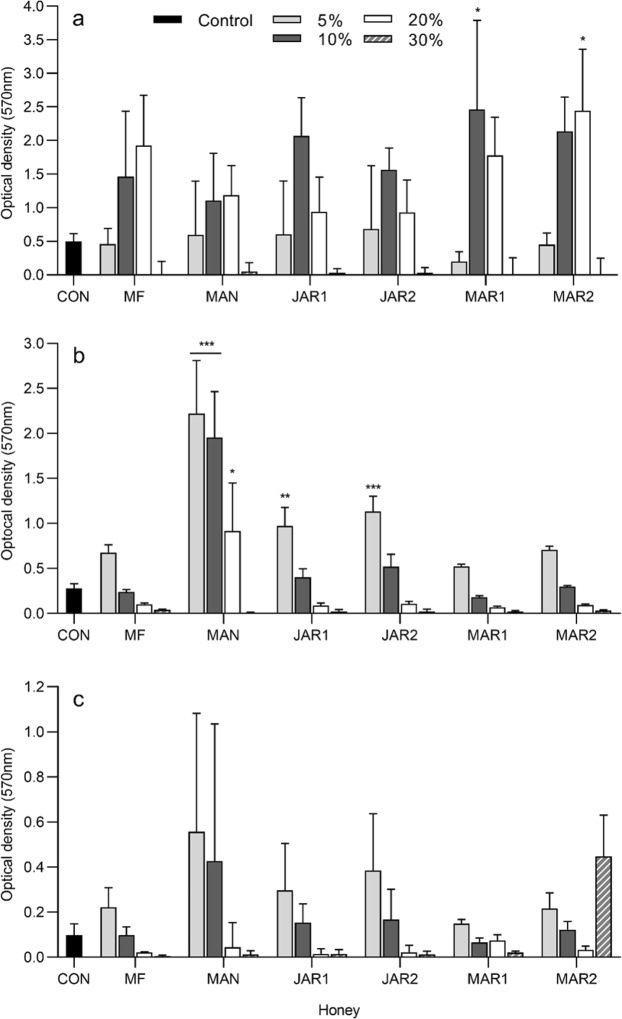
Figure 2.
Biofilm formation after 24 h in the presence of several concentrations of honey, determined by crystal violet staining (mean and standard deviation). (a) Pseudomonas aeruginosa ATCC BAA-47 (b) Enterococcus faecalis NCTC 775 and (c) Staphylococcus aureus ATCC 700699. Data were analysed by 2-way ANOVA and Tukey’s multiple comparisons post-hoc test. Asterisks indicate significant differences compared to the control (*P < 0.05; **P < 0.01; ***P < 0.001). CON untreated control; MF multifloral; MAN Manuka; JAR1 Jarrah 1; JAR2 Jarrah 2; MAR1 Marri 1; MAR2 Marri 2.

