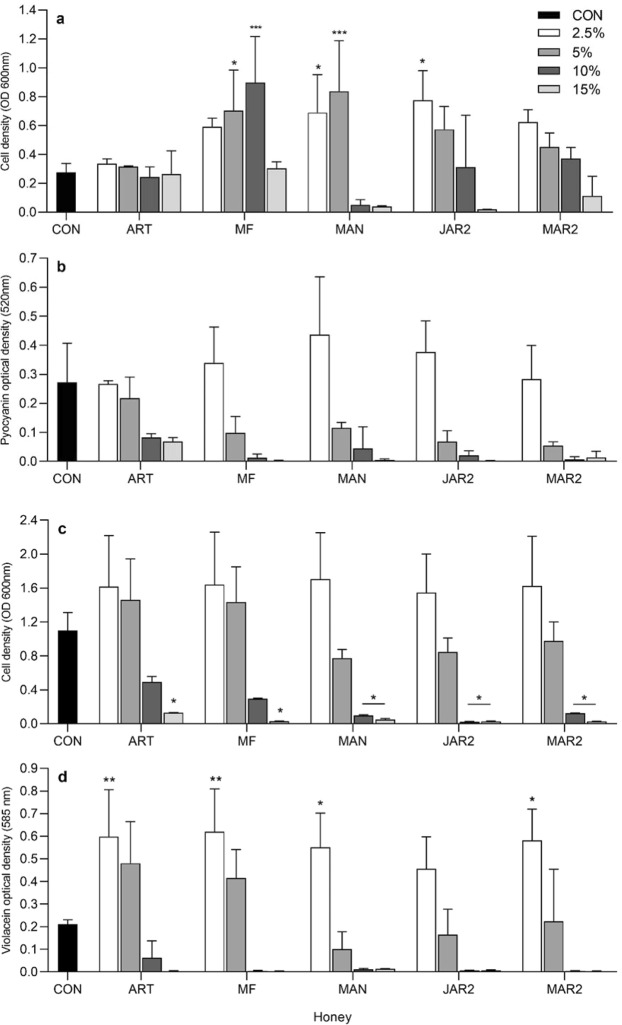
Figure 3.
Bacterial growth and pigment production in the presence of several concentrations of honey (mean and standard deviation). Growth (a) and pyocyanin production (b) for P. aeruginosa ATCC 27853. Growth (c) and violacein production (d) for C. violaceum ATCC 12744. Data were analysed by 2-way ANOVA and Tukey’s multiple comparisons post-hoc test. Asterisks indicate significant differences compared to the control (*P < 0.05; **P < 0.01; ***P < 0.001). CON untreated control; ART artificial; MF multifloral; MAN Manuka; JAR2 Jarrah 2; MAR2 Marri 2.

