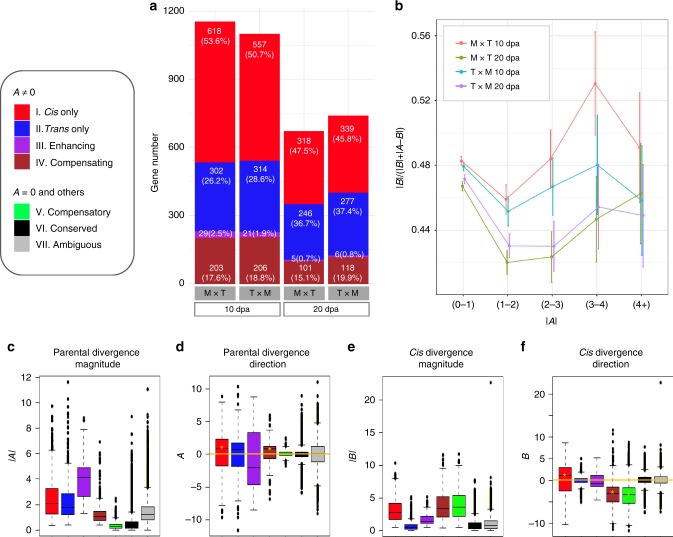
Fig. 2.
Categorization of cis and trans regulatory divergence. a Regulatory categories I–IV that exhibited parental divergence (A ≠ 0). In 10 and 20 dpa fibers from the reciprocal F1 hybrids M × T and T × M, gene numbers and relative percentages of these four categories were shown. b Proportion of cis regulatory contribution to parental expression divergence. Genes were binned by absolute parental divergence |A| in x-axis, and the amount of absolute total expression divergence due to cis effects |B|/(|B| + |A−B|) is shown on the y-axis with error bars depicting 95% confidence intervals. c–f Boxplots showing the magnitude and direction of parental expression divergence and cis regulatory divergence, as summarized by pooled M × T and T × M data at both the 10 and 20 dpa developmental stages. Boxplot elements: center line–median; box limits–upper (Q3) and lower (Q1) quartiles; whiskers–smallest and largest non-outlier; points–outliers. Y-axis values above zero in d, f indicate a bias toward higher parental and allelic Maxxa expression, respectively; similarly, below zero indicates a bias towards TX2094. The significant deviations from zero, as indicated by gold star symbol (*), was inferred by Student’s t-test (P < 0.05). Corresponding plots for each F1 hybrid at either stage are shown in Supplementary Fig. 2. Source data are provided as a Source Data file.

