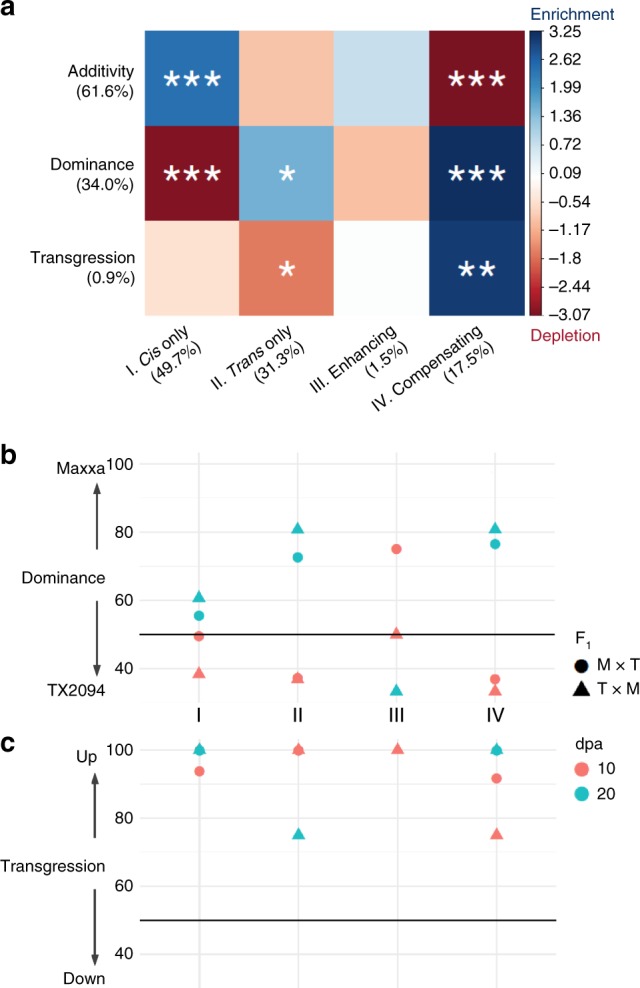
Fig. 3.

Relationships between regulatory mechanism and mode of inheritance. a For each combination of inheritance (rows) and cis/trans regulatory (columns) categories, the color shows the magnitude of gene enrichment (blue) and depletion (red) based on residuals of Pearson’s Chi-square test of independence. Blue indicates a positive residual when more genes were observed than expected under the null model of independence, and red indicates fewer genes than expected. Statistical significance was derived from Fisher’s exact test, as indicated by *P < 0.05, **P < 0.01, ***P < 0.001. b Within the category of dominance, percentages of Maxxa-dominant genes are shown for each regulatory category on the x-axis. c Within the category of transgression, the percentage of over-expressed genes are shown for each regulatory category on the x-axis. Source data are provided as a Source Data file.
