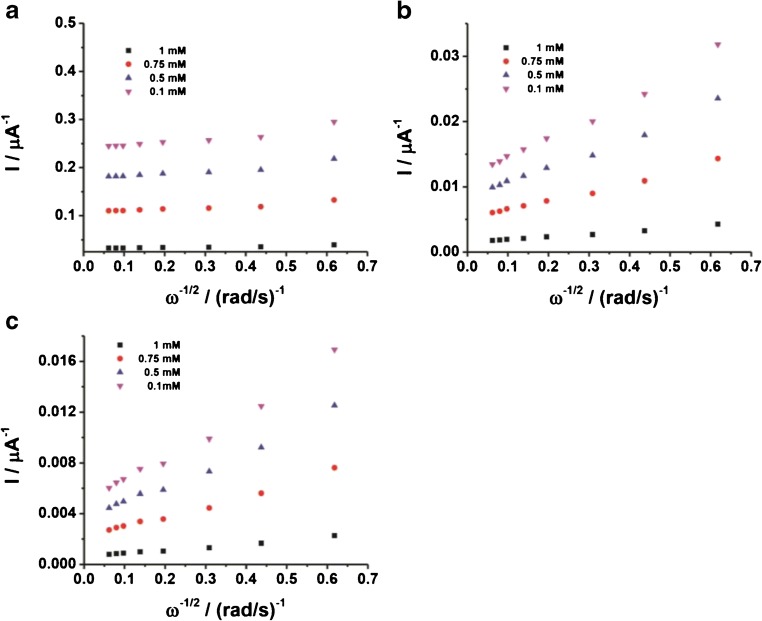
Fig. 4.
Koutecky-Levich plots in 50 mM NaAc buffer pH 4.5 in presence of 0.1 mM (purple), 0.5 mM (blue), 0.75 mM (red), and 1 mM d-(-)-fructose at different rotation speed from 0 rpm to 2500 rpm for a FDH/G, b FDH/AuNSphs/G, and c FDH/AuNTrs/G at scan rate 5 mV s−1. The measurements were carried out after 20 min N2 degassing and T = 25 °C. The current values were detected at E = + 0.4 V vs. Ag|AgClsat

