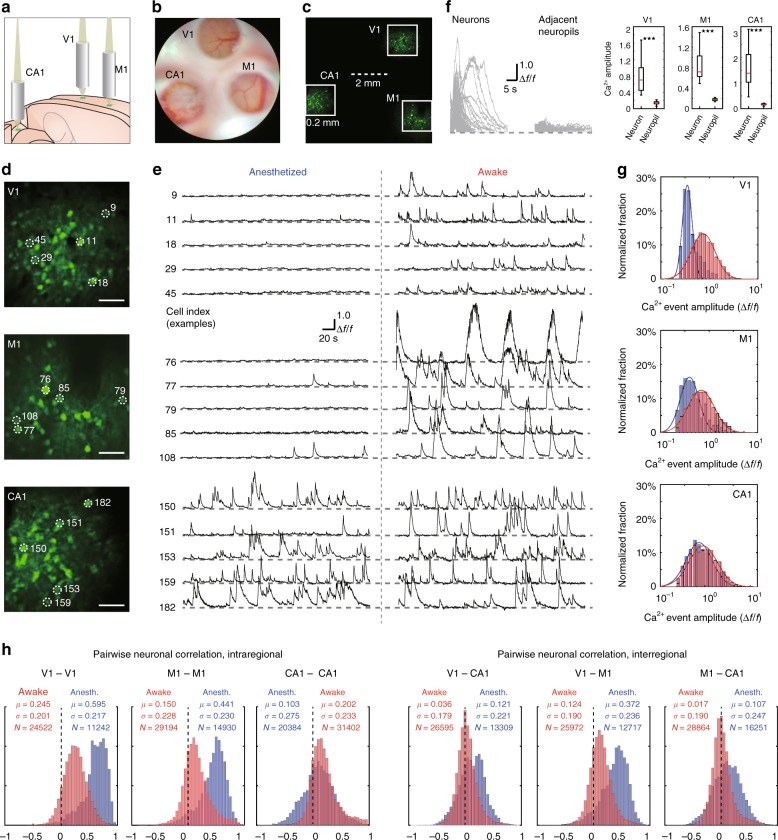
Fig. 4. Demonstration of MATRIEX imaging: simultaneously acquiring live neuronal activity patterns in V1, M1, and hippocampal CA1 in mice in the anesthetized state or awake state.
The neurons were labeled by a genetically encoded fluorescent Ca2+ indicator, GCaMP6f (see Supplementary Materials for details). a Illustration showing the positioning of three MOs over the V1, M1 and hippocampal CA1 regions in a model mouse brain. b A camera photograph taken through the microscope ocular lens under white light bright-field illumination, in which three FOVs are readily visible. The upper region is V1, the lower-left region is CA1, and the lower-right region is M1. c A two-photon image, which is an average of 100 frames, acquired by simple full-frame raster scanning with a two-photon microscope. The solid white boxes show the three parts of the image that are enlarged in panel (d). d Digitally enlarged individual FOVs showing neurons in V1, M1, and CA1, from top to bottom. Scale bar: 40 μm. e Time-lapse Ca2+ signal traces of five example cells from each region, with each labeled by the cell index. Recordings of the same cell in the same animal in the anesthetized state (left side) and in the awake state (right side) are shown. f Left: traces showing individual Ca2+ signal events (split from each onset time and overlaid) from randomly selected example cells. Middle: Ca2+ signal traces of each of the neuropil zones that are directly adjacent to each of the example cells. Right: three box plots comparing the neuronal Ca2+ signal event amplitude to the neuron’s adjacent neuropil Ca2+ signal amplitude; paired Wilcoxon rank sum test, ***P < 0.001. g Log-normal fitting of the distribution histograms of the spontaneous Ca2+ event amplitude for data pooled from all animals. The red bars and fitted curve show the distribution of data recorded in the awake state, and the blue bars and fitted curve show the distribution of data recorded in the anesthetized state. h Pairwise neuronal activity correlation (Pearson correlation coefficients) for data pooled from all animals. The red bars show the distribution of data recorded in the awake state, and the blue bars show the distribution of data recorded in the anesthetized state.

