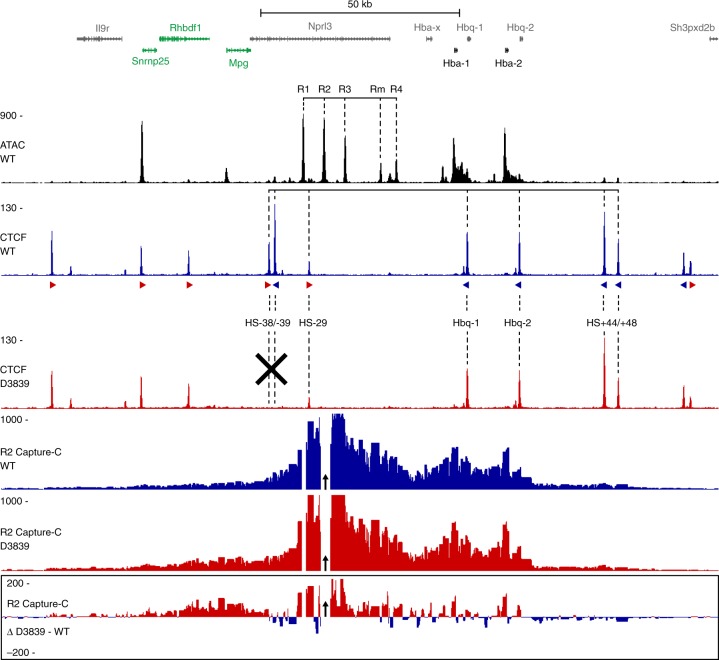
Fig. 1.
Characterization of a CTCF boundary deletion upstream of the α-globin locus. Gene annotation is shown at the top, with the α-globin genes in bold and genes upregulated by the CTCF boundary deletion highlighted in green. Open chromatin (ATAC in WT erythroid cells) is shown below, with the α-globin enhancers highlighted. CTCF occupancy in WT (blue) and D3839 (red) erythroid cells is shown underneath, with the orientation of the CTCF-binding motifs indicated by arrowheads (forward orientation in red; reverse orientation in blue). CTCF-binding sites of interest are highlighted and the deleted CTCF-binding sites are indicated with a black cross. The profiles below show Capture-C interactions from the viewpoint of the R2 enhancer (indicated with a black arrow) in WT (blue) and D3839 (red) erythroid cells, with a differential profile at the bottom. Profiles represent the mean number of normalized unique interaction counts per restriction fragment in n = 3 biological replicates. Coordinates (mm9): chr11:32,070,000–32,250,000.

