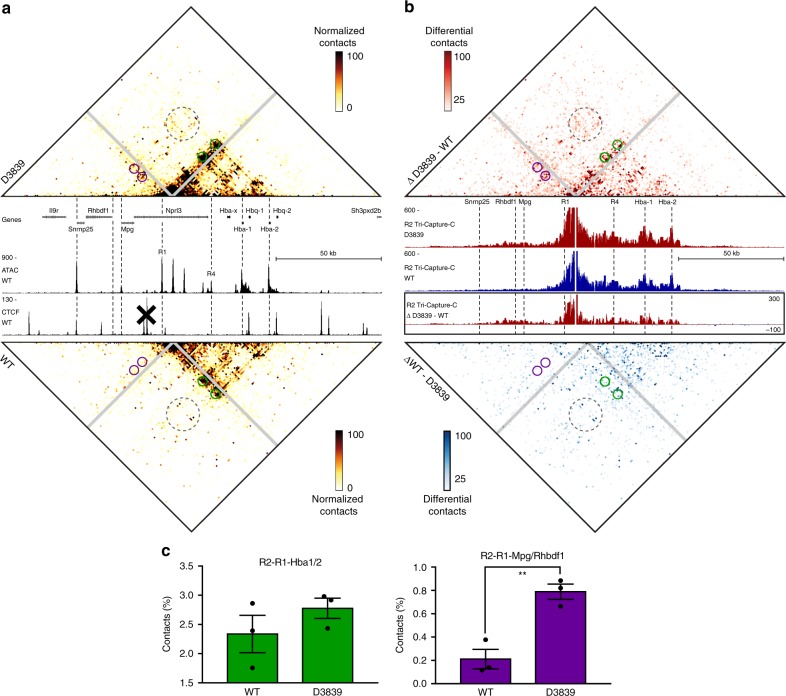
Fig. 2.
The formation of the enhancer–promoter hub at the α-globin locus is not dependent on the upstream CTCF boundary. a Tri-C contact matrices showing multi-way chromatin interactions with R2 in D3839 (top) and WT (bottom) erythroid cells. Matrices represent mean numbers of normalized, unique contact counts at 1 kb resolution in n = 3 biological replicates with proximity contacts around the R2 viewpoint excluded (gray diagonal). Gene annotation, open chromatin (ATAC) and CTCF occupancy in WT erythroid cells are shown in the middle. Coordinates (mm9): chr11:32,070,000–32,250,000. b Tri-C contact matrices showing differential multi-way chromatin interactions with R2 between D3839 and WT erythroid cells (top) and vice versa (bottom). Pair-wise interaction profiles derived from the Tri-C data from the R2 viewpoint (R2 Tri-Capture-C) are shown in the middle (D3839 in red, WT in blue), with a differential profile in the bottom panel. Coordinates (mm9): chr11:32,070,000–32,250,000. c Quantification of multi-way contacts between R2, R1, and the α-globin promoters (R2–R1–Hba1/2, green, P = 0.29) and R2, R1, and the Mpg and Rhbdf1 promoters (R2–R1–Mpg/Rhbdf1, purple, P = 0.0055). Quantified contacts are highlighted with corresponding colors in the matrices above. Numbers represent the proportion of these three-way contacts relative to the total in the matrix and are averages of n = 3 biological replicates, with individual data points overlaid as dot plots and the standard error of the mean denoted by the error bar. P-values were calculated by two-tailed t-tests.

