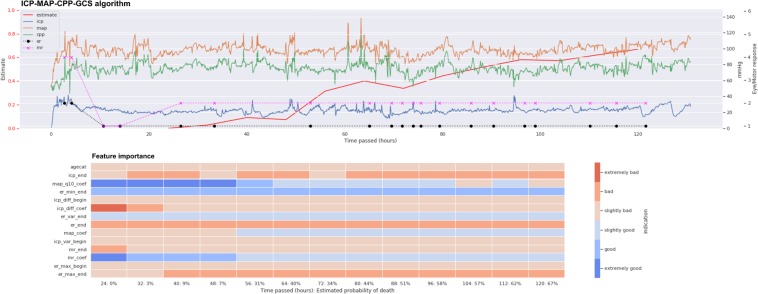
Figure 7.
Example showing the ICP-MAP-CPP-GCS algorithm for a patient with a fatal 30-day outcome. The upper part shows the prediction (red line, higher value for higher probability of death) and the trends of intracranial pressure (ICP, blue line), mean arterial pressure (MAP, orange line), cerebral perfusion pressure (CPP, green line), eye response (ER, black dots) and motor response (MR, purple crosses). The lower part shows feature importance with time (red color indicating that a high feature value increases probability of death and blue color indicating that a high value increase probability of survival). The patient’s predicted risk of 30-day mortality according to the IMPACT-TBI based model was 42%.

